Alan Jurison author is a senior operations engineer for Clear Channel Media + Entertainment’s Engineering and Systems Integration Group. He holds several SBE certifications including CSRE, CBNE, AMD and DRB.
In the United States, many broadcasters have employed HD Radio. While the initial focus of many broadcasters implementing HD Radio was to provide digital audio delivery to consumers, this emphasis has expanded in recent years. Data services delivered over HD Radio are an exciting and growing development in the industry.
All of the emphasis for data delivery via HD Radio has been on the FM band, as the data rate starts at 96 kilobits per second in standard MP1 hybrid mode. The audio channels on HD Radio use adjustable bitrate codecs, so the bitrate of the audio channel(s) can be reduced slightly to allow for additional data services in MP1. The available bandwidth in the hybrid system increases from 96 kbps, to 124 kbps in MP3 mode, and up to 149 kbps in MP11 mode.
Most automotive manufacturers are now including HD Radio in many of their latest vehicles. Data services could be considered in some ways a gateway to an increased adoption rate of HD Radio in the automotive environment. Because of the increasing receiver base for HD Radio, and the growing importance of data delivery via HD Radio (e.g. Artist Experience, traffic data, etc.), this paper hopes to add to the technical record the tangible benefits of elevated digital power.
Background Digital Power Level
The Federal Communications Commission first authorized the use of the hybrid HD Radio IBOC system in its First Report and Order, dated October 10, 2002. (MM Docket 99-325, FCC 02-286). This authority was expanded in its Second Report and Order, dated March 22, 2007 (FCC 07-33), where many of the engineering specifications of the system and operating conditions that are in use today were finally codified into official rules and regulations.
The initial average power level selected for the digital carriers was 1 percent of the analog effective radiated power (ERP) level of the host station, or −20 dBc.
Much testing was done with input from multiple parties to select a power level that provided what, at the time, seemed to be an effective digital coverage area, while at the same time balancing concerns about interference to adjacent FM stations.
Unfortunately, after many stations had adopted the FM hybrid system at the initial −20 dBc operating power level, it became apparent that the digital coverage did not fully replicate the analog coverage, particularly in mobile edge-of-coverage and indoor environments.
Many of the initial parties began researching and testing the use of elevated digital power levels in 2007. In 2008, a formal request was submitted to the commission to allow a blanket authorization to increase digital carrier power to 10 percent of the analog power, or −10 dBc. The request for a power increase caused considerable debate within the industry.
The end result was the Commission’s Third Order dated Jan. 27, 2010 (DA 10-208), which was a compromise between those requesting a blanket −10 dBc authorization and those who wanted no potential additional interference with levels remaining at −20 dBc. This order established a blanket authorization of increased digital power to −14 dBc for most stations, a procedure for some stations to increase from −13.9 dBc to −10 dBc with a special engineering exhibit and a special procedure for grandfathered super-powered stations.
Current State of Elevated Power Operations
These rules have been in effect for more than four years, and the amount of real-world testing and experience with elevated powers continues to increase as stations invest in upgrading their transmission facilities to achieve higher digital powers.
As of Jan. 7, 2014, the commission reported that 50 FM station licensees had increased digital power between −13.9 dBc and −10 dBc. Ten super-powered FM stations had requested increases. Five or fewer broadcasters have applied for experimental authorizations of asymmetrical sideband power authorization.

Table 1: FCC Digital Notification Form 335 Data As Of 2-5-2014 To date, the commission has not officially tracked, nor tallied, the number of digital notifications under the blanket authorization between −19.9 dBc and −14 dBc. However, in order to gain some perspective on how many broadcasters have adopted elevated power levels, I explored the commission’s CDBS database and located the data from the FCC Form 335 Digital Notification applications. This data is summarized in Table 1. Note, this form was not available when the Third Order authorizing elevated power levels was adopted. Stations that immediately increased power after the Third Order are likely not included in these statistics.
Note: Numbers in the table do not reflect stations that notified the Commission via letter before Form 335 was available, stations that applied for increased digital power via Special Temporary Authority (STA) or Experimental Authorizations.
Before locating the statistics in Table 1, my dialog with other engineers around the country had indicated many have started to increase digital power on select stations. Often when a station is in need of a new transmitter or other transmission system updates (i.e. new antenna, etc.), many station licensees are using the opportunity to ensure their facilities can transmit higher digital powers. Others have invested in these facilities because they were not pleased with the initial performance at −20 dBc. It is encouraging to see that since the Form 335 Digital Notification process has been in place, 87 percent of stations notifying the commission have implemented elevated carriers at some level; 57 percent have implemented the maximum blanket −14 dBc power level; and 71 percent are operating at −14.9 dBc and higher.
With more than 365 stations running at some elevated power level, the Audio Division of the FCC has not had to order any FM station to reduce digital power or cease digital operation due to interference to an analog FM station.
As the largest operator of commercial broadcast stations in the United States, Clear Channel Media + Entertainment likely has the largest collection of elevated digital power stations in the country.
Elevated Power Studies
The coverage studies provided to the commission in 2007–2008 time periods were based on the −10 dBc digital power level. Unfortunately, it appears that few or no coverage studies were conducted at the blanket −14 dBc power level that ended up being the compromise from that proceeding.
Over the last year and a half, I have driven thousands of miles in many different markets monitoring and logging the reception characteristics of elevated digital signals. The stations I have had the opportunity to study in depth have operated in the range between −14 dBc to −20 dBc. For purposes of this technical paper, I will focus on the differences of these two power levels on stations operated by Clear Channel Media + Entertainment
New York City – Empire State Building

Table 2: CCM+E Empire State Building Transmission Specifications Clear Channel Media + Entertainment operates five FM stations combined into the ERI “master” antenna atop the Empire State Building in New York. At the time of this study, the technical data for these facilities were as listed in Table 2.
The previous coverage studies from 2007–2008 of power levels between −20 dBc and −10 dBc involved collecting data by driving a designated route and monitoring the lower power level to establish a baseline. Then digital power was increased to the elevated level and measurements were made on the same routes at a later time. This method of testing is very lengthy and time-consuming.
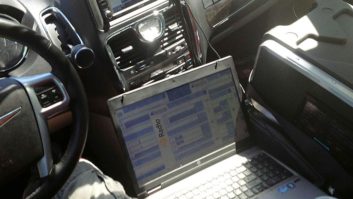
More recently, an extensive test drive in New York enabled me to collect data comparing digital power levels for these five signals during a single drive test. Measurement of these signals was performed concurrently, using multiple Audemat Navigator HD data-logging receivers in a single vehicle. This device records the analog and digital performance of a selected radio station and combines this data with GPS location data, which is logged on a laptop computer. The tests were conducted alongside a JVC KW‑NT800HDT aftermarket automotive HD Radio. The reception characteristics of the Audemat Navigator HD receivers and the JVC radio are very similar. Thus, the data collected and the maps shown below are indicative of what a listener in an automotive environment may experience in a particular location.
Fig. 1: Test Setup 1/4-Wavelength “Mag Mount” Antennas
(Click to Enlarge) The test setup in the initial drive data collection test is depicted in Fig. 1. Each Audemat Navigator HD receiver was furnished with its own calibrated 1/4-wavelength mast “mag mount” antenna and calibrated cables to record received analog signal strength values. In an effort to keep those readings relevant, and to keep the digital signal as pure as possible (i.e. not add splitters and amplification), each magnetic mount antenna was placed on the roof of the test vehicle and spaced apart. In addition, a Larsen NMOQ 1/4-wave mast was also used for the JVC aftermarket automotive receiver. I recognize that this technique can create a potential for some directionality of reception, but having performed these tests in many cities across the country in both travel directions, I have found that the directionality has little impact on the overall data collection and the listener experience. It is, rather, indicative of “real-world” testing, as most OEM automotive antenna designs have some form of directionality. In my experience, some vehicle antennas have what I would consider an alarming amount of directionality, which could be an entire research topic and is outside the scope of this paper.


Fig. 2: Map Key Discussion for Figures 3–15 With the vehicle equipped, data was collected on most major highways in the coverage area of the New York stations mentioned above. The results were later converted into KML files and plotted in Google Earth. The values shown in Figs. 3 through 15 are IBOC QI (Quality Indicator) values. These are shown in the key in Fig. 2.
The QI scale is from 0 (no signal) to 15 (good signal). Due to the “on/off” nature of digital reception, most of the values logged were 15 or 0. Good reception, or a QI value of 15, is denoted by green circles. No reception, or a QI value of 0, is denoted by red circles. There are some intermediary areas where a value of 9 is recorded denoted by a yellowish green combination. Google Earth treats multiple overlapping points as semi-transparent images, so sometimes the red QI=0 and yellow QI=9 areas appear as orange circles. These areas generally have a buffer starvation situation, where the radio is going in and out of FM analog and HD Digital reception (blending) when tuned to the HD1 Main Program Service (MPS). When listening to an HD2 or HD3 Secondary Program Service (SPS), this is where you would typically hear dropouts or digital artifacts. Also note, the Audemat Navigator HD will eventually, after a period of time of QI being 0, fade to analog. When it does this, it no longer plots any data on the route until the receiver recognizes the digital signal again, at which point it will mute and then buffer audio when the QI value equals 15.
In the results below, I will focus on WLTW, which was running −14 dBc and compare it to WHTZ, which was running −20 dBc, the original digital power level authorized by the commission. It should be noted that results of these two stations have been compared to the other three stations operating at various power levels, and they exhibit a similar differential between −14 dBc and −20 dBc. For the sake of brevity, the diagrams and analysis shown will focus on WLTW and WHTZ.
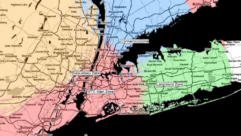
One of the most challenging coverage areas in the New York metro area is in the hilly terrain in New Jersey. Of particular difficulty is the I‑287 corridor stretching from Mahwah through Morristown and south to Bridgewater. Also included in this area are parts of the I‑78 corridor. This area falls well within the predicted FCC F(50,50) 54 dBu coverage contour of all five stations at the Empire State Building, but due to terrain, it is a challenging environment for all stations in the market to cover. Though this area lies only 15–25 miles from the Empire State Building, analog FM reception can be noisy, with frequent multipath episodes and fading. Many people commute from this area into Manhattan on a daily basis.
Fig. 3 (left): I-287 New Jersey Corridor WHTZ −20 dBc 1/4-Wave Antenna; Fig. 4 (right): I‑287 New Jersey Corridor WLTW −14 dBc 1/4-Wave Antenna
(Click to Enlarge) Fig. 3 depicts WHTZ at −20 dBc in this corridor. There are many stretches of this corridor where HD reception is nonexistent. Many complaints have been logged by listeners in these areas that digital reception was inadequate, and the measured results clearly show that.

Fig. 4 shows WLTW at −14 dBc in this corridor. The 6 dB improvement makes a remarkable difference. Many areas that had no digital reception suddenly have filled in. A radio tuned to WHTZ HD2 is mostly in silence, where listening to WLTW HD2 offers a much better experience. That being said, at −14 dBc, there are several areas of no digital reception, depicted by the red circles on this route. Those same areas still provide analog FM coverage, albeit with impairments. Yet analog FM is still listenable in this area. This corridor is a good example of how −14 dBc falls short of replicating analog FM coverage.
THE DECLINE OF THE WHIP ANTENNA
As noted previously, the results in Figs. 3 and 4 were using 1/4-wave mast “mag mount” antennas. However, in my experience these antennas tend to be a “best case” scenario. While historically, vehicles were equipped with external whip-style antennas, these have largely become a thing of the past. Automotive designers are focused now more than ever on aesthetics of the vehicle and also aerodynamics for noise reduction and fuel economy. Some of the better, lower-profile concealed antennas I have experienced are the external “shark fin” antennas. However, even those are starting to fade from automotive designs. Many vehicles are resorting to concealed “in-glass” antennas, which are generally located on the rear window or a side rear window. In my experience, these designs tend to provide poorer reception characteristics.
In the analog realm, it’s difficult and perhaps subjective to quantify the effects of antenna type on reception. Moreover, analog radios can use various techniques to mask the lack of adequate signal with monaural blending and diversity antenna reception. With digital, these techniques do not work. Diversity antenna reception for HD is not currently available in any OEM design. When HD coverage data is collected, it is much easier to compare antenna performance with some of these concealed antennas. Adapting the techniques used in Fig. 1, I have conducted several tests to map digital signals using automotive OEM antennas.
Fig. 5: Test Setup OEM In-Glass Antenna
(Click to Enlarge) The setup on an OEM antenna drive data collection test is depicted in Fig. 5. The OEM antenna for the particular test vehicle is used. Instead of connecting the antenna to the factory-installed radio, it was adapted into standard BNC connectors and then run through an FM bandpass filter, variable attenuator, low-noise RF amplifier, and an eight-port passive splitter. A spectrum analyzer was used to calibrate the system using the variable attenuator to ensure the amplifier was only making up for the losses of the bandpass filter and the eight-port passive splitter. Essentially, the system was at unity gain, and each port of the eight-port splitter was within approximately 1 dB of measured signal from the original output connector that was destined for the factory-installed radio.

With that system in place, the outputs of the splitter fed each Audemat Navigator HD receiver, a JVC aftermarket automotive receiver, and also several data-logging receivers provided by iBiquity used to measure and extract some of the advanced data service provided by the HD Radio transmission system, such as Artist Experience.
I recognize that this technique can create a potential for some anomalies, especially if the amplifier is overloaded. However, like the tests above, this data collection is more in line with measuring what the listener experience would be in a given area. And in fact, results of these tests were compared to an identical vehicle that was directly connected to a JVC aftermarket HD receiver that was following the main test vehicle. When reception was lost or became intermittent in one vehicle, the other vehicle soon followed. Thus, I feel confident the data collected in these tests is indicative of what you can expect to see with some integrated in-glass OEM test designs.
Fig. 6 (left): I-287 New Jersey Corridor WHTZ −20 dBc OEM Antenna; Fig. 7 (right): I‑287 New Jersey Corridor WLTW −14 dBc OEM Antenna
(Click to Enlarge) Fig. 6 depicts WHTZ at −20 dBc in the same corridor, this time with the OEM in-glass antenna. The differences between the 1/4-wave mast “mag mount” antenna as shown in Fig. 1 and the OEM antenna shown in Fig. 5 are pronounced. Many of the areas of no HD reception, indicated in red, are extended, essentially yielding very little HD coverage on the I‑278 corridor at the −20 dBc power level.

Fig. 7depicts WLTW at −14 dBc also with the OEM in-glass antenna. As you can see, some of the coverage gain that we have at the −14 dBc power level is lost due to the lower performance from the OEM antenna.
WESTCHESTER COUNTY DIGITAL RECEPTION
We also tested digital performance in Westchester County in the northern portion of the New York metro area. Westchester’s terrain presents significant challenges for both analog and digital reception. Many parts of Westchester are affluent suburbs of the market, and there are many commuters that drive daily to Manhattan for employment. This area lies only 25–35 air miles from the Empire State Building, and also is well within the FCC F(50,50) 54 dBu contour for standard Class B stations transmitting from Empire. The test route area is characterized by significant terrain variations and separated from Manhattan by an area of ridges and valleys through which pass the Saw Mill River, Bronx River and Hutchinson River Parkways. Valley-to-ridge elevation changes are on the order of 300 to 400 feet. Cross Westchester Expressway (I-287) traverses the central portion of this ridge and valley area.
Fig. 8 (left): I‑287 New York Corridor WHTZ −20 dBc 1/4-Wave Antenna; Fig. 9 (right): I‑287 New York Corridor WLTW −14 dBc 1/4-Wave Antenna
(Click to Enlarge) Fig. 8 depicts this area with WHTZ at −20 dBc and Fig. 9 is WLTW at −14 dBc. As you can see, the 6 dB does make a difference. It completely fills dropouts in Hartsdale and makes a significant improvement in White Plains and Elmsford. Yet there are still significant periods of no digital reception along the Cross Westchester Expressway and the New York State Thruway (I‑87) corridor right before the Tappan Zee Bridge. Off the highway slightly north of this is White Plains Road (NY‑119), which is a commercial roadway featuring business, shops and a gateway into residential communities. Some of the businesses on this roadway between Elmsford and White Plains are new car automobile dealerships.

Even with stations at −14 dBc, it’s clear these dealerships cannot demonstrate an enjoyable digital radio experience to potential customers.
Fig. 10 (left): I‑287 New York Corridor WHTZ −20 dBc OEM Antenna; Fig. 11 (right): I‑287 New York Corridor WLTW −14 dBc OEM Antenna
(Click to Enlarge) Moreover, with the in-glass OEM antenna designs often providing slightly lower performance than the optimal 1/4-wave antenna design, the problem becomes even more exacerbated in this area. Fig. 10 shows WHTZ at −20 dBc with an in-glass OEM antenna on the Cross Westchester Expressway and Fig. 11 shows WLTW at −14 dBc. The pink markers indicate local car dealerships in the area. At −20 dBc, the HD signal is so low the Audemat Navigator blends to analog reception and stops logging data for a period of time, depicted with not even red circles on the map. While WLTW at −14 dBc shows improvement, many automotive customers with HD Radio are underserved with a −14 dBc power level in this area.

Los Angeles — Mount Wilson
Shifting to the second largest metropolitan area in the United States, Los Angeles, stations running elevated digital power are difficult to find. This is due to the fact that most of the stations in Los Angeles are on Mount Wilson and operate as grandfathered super-powered stations. These stations are licensed as Class B FM stations, but generally have analog ERP and HAAT values far in excess of class facilities. Under the provisions of the Third Order, there is room for some grandfathered stations to increase power, but the majority of the stations on Mount Wilson do not qualify under those rules and thus many stations are capped at the original authorized power at −20 dBc.

Table 3: CCM+E Los Angeles Mount Wilson Transmission Specifications While many of the stations on Mount Wilson are grandfathered super-powered stations, their facilities are not equivalent. Each station has a unique ERP and HAAT combination that varies from 0.4 dB to more than 18 dB above Class B maximum facilities. Since almost all of these stations are capped at −20 dBc, some stations on Mount Wilson perform better than others in the digital realm because they are grandfathered at higher power levels. While the list of all the stations is too large to publish, the stations that Clear Channel operates from Mount Wilson are summarized in Table 3.
The power difference between the highest-powered digital facility in Table 3 (KBIG) and the lowest value (KIIS) is 9.1 dB.
In my signal measurement testing in Los Angeles, I compare KBIG and KIIS, as they represent two widely different power levels. The results between the two in the field are noticeable.
Fig. 12 (left): Burbank KIIS −20 dBc (−9.1 dB KBIG) 1/4-Wave Antenna; Fig. 13 (right): Burbank KBIG −20 dBc (+9.1 dB KIIS) 1/4-Wave Antenna
(Click to Enlarge) Fig. 12 depicts KIIS and Fig. 13 depicts KBIG in the I‑5, US‑101, CA‑170 corridor in the Burbank area. While both stations are running at −20 dBc, the lower-powered KIIS does not adequately cover this very important section of the Los Angeles metropolitan area. While KBIG is still at −20 dBc, its digital power is 9.1 dB higher than that of KIIS, filling in much more of this area. Yet still, KBIG suffers some dropouts on I‑5. One might argue that KBIG does a decent job replicating its analog coverage especially in close-in locations like Burbank. However, it falls short in the far-field.

Edge-of-coverage analysis can be tricky in any market when there are localized terrain obstructions in the far-field that block digital and analog reception of any distant transmission. Traveling south from downtown Los Angeles on I‑5 offers arguably one of the clearest views to perform an unobstructed signal analysis. Fig. 14 depicts KIIS and Fig. 15 depicts KBIG in this region. The blue line depicts the 54 dBu contour. Even KBIG with its high digital ERP falls short of its analog coverage in San Clemente, which is in southern Orange County and still part of the Los Angeles radio market. The digital signal of KIIS, which is 9.1 dB lower, falls off approximately 20 miles north on I‑5.
Fig. 14 (left): Orange County KIIS −20 dBc (−9.1 dB KBIG) 1/4-Wave; Fig. 15 (right): Orange County KBIG −20 dBc (+9.1 dB KIIS) 1/4-Wave
(Click to Enlarge)

KIIS also struggles to provide adequate digital coverage in the coastal cities of Long Beach, Huntington Beach and Costa Mesa on the Pacific Coast Highway (CA‑1). These areas have acceptable analog mobile reception, yet the −20 dBc digital power level on KIIS does not come close to replicating the analog coverage in this region. KBIG with its higher digital power fares much better here until south of Costa Mesa, where digital reception is not viable from Newport Beach to Dana Point. It is important to note that there is localized terrain in this area that, when combined with the significant distance from Mount Wilson, would likely impede a digital signal at any power level.
Discussion
I have spent a considerable amount of time in the past two years researching, mapping and studying digital FM stations in a variety of markets and configurations. It is my opinion that, while the increase from −20 dBc to −14 dBc is significant and has created improvements, it almost always falls short in replicating a station’s analog coverage.
Most other forms of entertainment have transitioned to digital. In order for radio broadcast services to remain relevant, the conversion to digital must continue. Exciting new services are being offered via HD Radio technology and those services are being implemented by automotive manufacturers.
These new features are important to keep radio relevant and competitive with other digital technologies in the car. Millions of new HD Radio receivers are on the marketplace and being sold in automobiles each year and that trend is sure to continue. As more consumers obtain HD Radios, they will find that the coverage is not comparable to what they enjoyed in the analog realm.
Even with the blanket −14 dBc power level, there are still areas in every market that I have analyzed that could use additional digital power to be at par with the analog coverage expectations.
While the elevated power level of −14 dBc has resulted in significant improvement, there still may be benefits of an even higher power level of up to −10 dBc. The results submitted by iBiquity in 2007 and 2008 show that −10 dBc is compatible in most situations. Research in this area has remained dormant for several years. I suggest that, in light of research showing −14 dBc is not always adequate, perhaps −10 dBc coverage and interference studies should be reevaluated.
In the 2010 Third Order, the FCC stated “The bureau’s experience with higher powered digital experimental authorizations suggests that the formula … is overpredictive of the potential for interference.” As indicated earlier in this paper, to date, with more than 365 stations operating at elevated digital power levels, not a single station has been ordered to reduce digital power or cease digital operation. Unfortunately, this restrictive formula in use has effectively slowed the progress of digital radio advancements.
We now have more than four years of elevated digital power operations under the new rules. The record of elevated power stations extends as far back as seven years. Many complaints are logged by people regarding the underperformance of their digital radios. Those complaints and the dissatisfaction of listeners will only increase as millions of additional digital radios are sold each year. If current trends continue, by the end of the decade, digital radios will reach critical mass. I feel the industry is woefully underprepared for how inadequate −14 dBc coverage can be.
I hope this research sheds some new light on elevated FM IBOC performance at the −14 dBc power level. Perhaps we, as an industry, can work together constructively to research the implications of lifting some of the restrictions and encourage wider adoption of −10 dBc power levels.
Let us also start a dialog on how we can perhaps devise some relaxation in the rules to allow for some meaningful power increases in the super-powered-heavy markets of Los Angeles and San Francisco, or at least start to level the playing field for those grandfathered stations, which are now suddenly far less competitive than some of their other in-market peer stations.
Let us use the interference resolution procedures outlined in the Third Order (or some mutually agreeable update of them) to regulate any interference complaints. Using today’s technology, converting a station that went to –10 dBc back down to –14dBc is a few touchscreen commands away. It is simple to do, and if the complaint is related to just one adjacency, let us allow asymmetrical sideband technology to be used as a way to mitigate any interference complaints that may come to light.
Why should we hold back and harm the entire industry from having a successful digital transition based on concerns that still, to this date, have not materialized? Let us ensure there are safeguards in place to mitigate any interference on a case-by-case basis. The time has come for additional research, evaluation and discussion on –10 dBc digital operation.
Acknowledgements
Elevated power numbers and information obtained by the Federal Communications Commission current as of Jan. 7, 2014. Information provided by Janice Wise and Susan Crawford.
Special thanks to Russ Mundschenk, et. al. at iBiquity Digital Corp. for providing suggestive measurement techniques to perform more in-depth coverage analysis of OEM antenna designs.
This paper was presented at the 2014 NAB Show Broadcast Engineering Conference in April.