The following interview appeared in the recent Radio World eBook “Propagation Analysis for Profit.”

Read the full ebook at radioworld.com/ebooks.
Doug Vernier is president and owner of V-Soft Communications, a provider of RF propagation software programs that assist engineers in evaluating interference and coverage for radio and television stations, such as FM Commander, AM-Pro and Probe. We asked him about choosing software, using Longley-Rice for coverage evaluation and implementing single-frequency networks, among other topics.
Radio World:I’m a station engineer and I would like to have the ability to do basic evaluations of station coverage areas for my management. What kinds of software should I consider purchasing? Are there other forms of access to this type of software, short of outright purchase?
Vernier: If you are willing to purchase software for this purpose, it is wise to look at software that has a proven record for prediction accuracy, gives you significant flexibility for doing what-ifs and that integrates population and interference analysis into a single user-friendly package. The software should be capable of using a wide variety of terrain databases, land-cover databases and the latest population data available from the U.S. Census Bureau and it should be able to easily produce attractive maps. If the programs of the vendor are also in daily use at the FCC, you can be sure that the answers produced will have credibility and will ensure matching FCC results.
For purchased software, the user should select a vendor that provides a high level of regular support for the user. Changes in the FCC rules or in the station database contents that the program uses should be provided by the vendor. This would include regular program code updates that keep the program fully accurate as time proceeds.

Doug Vernier
RW: Your company offers a specific program for FM and AM frequency work and one called “Probe.” How do these differ?
Vernier: The AM and FM programs are quite different due to the differences in the rules for allocating frequencies in these broadcast bands. Either of the programs can find new frequencies, upgrade station classes and produce high-quality maps. AM Pro is in regular use at the FCC to vet incoming applications from engineers and owners. Probe is a multifaceted program that allows one to use a large number of different propagation prediction routines, determine the extent of outgoing and incoming interference to both FM, FM and TV translators or booster stations, as well as DTV stations, and to produce atlas quality maps of coverage and interference areas, showing where population is lost or gained.
As far as free goes, the FCC has a few programs that will project service contours. FMQuery, the FCC’s tool for acquiring data and filings for FM radio stations, is available for free on the internet. Drilling down within this on-line program will take you to links that plot an FM facility’s primary service contour to FCC accuracy. The program will display the standard 60 dBu contour over open street maps or USGS maps. The AM version of the FCC’s coverage tool (AMQuery) will plot the 0.5 and 2 mV/m groundwave service contours. The commission’s TVQuery plots the noise-limited service contour of DTV TV stations over base maps.
The Radio Locator is an online program often used by the beginner to look at existing station coverage. The program plots contour lines over area maps that represent local, distant and fringe listening. The contour values are not specifically labeled on the maps, making comparisons to FCC data a bit more difficult.
RW: What is a Longley-Rice study and how does it compare to the FCC method of predicting coverage contours?
Vernier: One thing to remember is that any of the prediction methods to determine where your signal goes are just that: “predictions.” Nearly anyone will tell you that predictions will have some degree of error, from “absolutely wrong” to “pretty good.”
The FCC’s contour prediction method for FM broadcast stations uses actual measured signal curves and average radial antenna heights over 3–16 km terrain. With the input of these radial heights above average terrain (usually eight evenly spaced radials) and the effective radiated power, the FCC curves will predict the coverage signal levels at a distance.
The FCC method is okay for general use by the FCC in an effort to predict station coverage and interference; however it tends to be overly protective in many cases because it does not look at terrain beyond 16 kilometers. This means that tall signal blocking hills or mountains, just beyond the 16 km distance, will not be seen and a station’s coverage will be projected as if the mountains didn’t exist. On the other hand, if the transmitter is situated high on a mountain top with a ridge or two found below within the 16 km path to a distance city that also had high elevation, the real path to the city would be line-of-sight. The interfering signal will be unaffected by terrain, resulting in under predicting the interference.
The Longley-Rice method offers many degrees of improvement over the FCC contour method, including using the terrain all the way from the transmitter to the listener or viewer’s location. This model has recently been used by the commission to determine the new DTV re-channeling allocation scheme. It has become the commission’s de facto DTV prediction method.
Longley-Rice goes well beyond the FCC curves, considering atmospheric absorption, including absorption by water vapor and oxygen, loss due to sky-noise temperature and attenuation caused by rain and clouds. It considers terrain roughness, knife-edge (with and without ground-reflections), loss due to isolated obstacles, diffraction, forward scatter and long-term power fading. The model’s code is available freely to the public. The Longley-Rice model and our V-Soft Communications implementation of it require the following inputs for analysis based on multiple point-to-point paths:
● Frequency (20–20,000 MHz)
● Transmitter antenna height (above mean sea level, meters)
● Transmitter antenna height (above ground, meters)
● Transmitter power
● Transmitter antenna pattern
● Receiver antenna height (above ground, meters)
● System antenna polarization (vertical or horizontal)
● System Ground Conductivity (mhoS/m)
● System dielectric constant (permittivity)
● System minimum monthly mean surface refractivity (adjusted to sea level.)
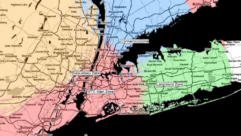
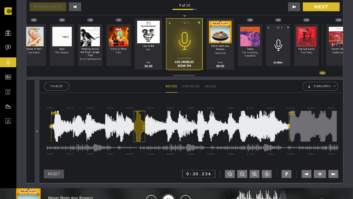
Fig. 1: V-Soft implementation of the Longley-Rice method.
Click to enlarge

The Fig. 1 map shows the V-Soft implementation of the Longley-Rice method. Note that when using Longley-Rice the color coding represents the signal strength areas as predicted by the method. The reader will notice that the effect of signal by terrain is shown clearly where the terrain drops off along rivers and lakes.
There are other models than Longley-Rice that predict coverage. Some are better than others. However, actual proof of that rests in comparing the model’s prediction with actual measurements. For many reasons, this is difficult to do accurately. All models use the attenuation provided by urban clutter. Some simply subtract a fixed amount of signal along the entire path, while others use land cover attenuation that is defined by latitude and longitude coordinates. Still other models, such as Okumura, use the height above average terrain to calculate path loss but do not consider terrain obstacles. The Okumura method was developed for highly populated areas where two story buildings predominate, such as in Japan. Its algorithms have been improved along the way by Hata and Davidson, thus we also have Okumura/Hata and Okumura Hata Davidson.
Many users, such as the U.S. Army and Navy, prefer the Terrain Integrated Rough Earth Model that is known to do better than Longley-Rice over large bodies of water. TIREM was developed using data from Technote 101, a two volume Treatise published by National Bureau of Standards that also is the base for Longley-Rice. The model was developed originally at university level and later sold to Allion Science and Technology Corp. of Annapolis, Md. Allion made the code proprietary which places a damper on its wide use by the FCC and others since there is no way to know how precisely it’s predictions are made.
The ITU method is used widely in Central and South America. It uses a set of propagation curves that are based on measurement data mainly relating mean climatic conditions in temperate climates. The model considers the transmitter height above average terrain, the receive antenna height, and incorporates a correction for terrain clearance angle when making field strength predictions.
The Point-to-Point or PTP method was developed by Harry Wong of the FCC’s Office of Engineering and Technology. Its processes are based on radio diffraction and attenuation to the free space path caused by irregular terrain entering the Fresnel zone. Although published in the FCC rules as a method of considering terrain roughness, the method was not adopted by the Mass Media Bureau.
The propagation methods described above are not, by far, the entire list of those used to determine where signals go; however they are considered the ones in popular use. Currently, the FCC accepts the Longley-Method for the majority of alternative showings it receives.
RW: What is knife-edge diffraction and how does it affect coverage?
Vernier: “Knife edging” is when the radio wave diffracts, or bends, as it passes over the sharp edge of an obstacle that lies across the wave’s direction of movement. Part of the signal is cut off by the terrain edge, and the other half is diffracted downward. Knife-edge diffraction can be helpful in serving areas that would normally not be able to receive reception due to the large terrain blockage. It is important to note that the shape of the diffracting terrain is important to the amount of diffraction produced by the obstacle. There are areas nestled in the mountains where the only reception available is through knife-edge diffraction.
RW: What is the best method to make field measurements of FM coverage areas?
Vernier: There are numerous considerations to make when taking actual measurements. Often the engineer taking measurements can fall into the trap of doing everything right except one thing that seriously impacts the accuracy.
A short list of things that cause inaccuracies:
A. Failure to use a calibrated reference antenna and failure to apply those correction factors to the field strength of the frequency being measured.
B. Failure to use an omnidirectional antenna. (Antennas mounted to a car for a drive test will be directional, so turns by the car will affect signal strength.) In one NPR Labs study, engineers installed a circular ground plane to go atop the car under the vertical whip antenna that helped circularize the antennas pattern; however the engineers found that the car was still somewhat directional.)
C. Failure to recognize the impact of the vertical elevation field
D. Failure to place the receive antenna above blocking terrain obstacles. (This is impossible if the transmitter is city-bound.)
Engineers have taken to a costly project of measuring an antenna’s pattern by using an airplane or helicopter to “fly the tower” with a calibrated antenna. One of the issues they have run into is maintaining exact distances and elevation along the circle route. Lately engineers have begun to experiment with drones to replace the costly airplane/helicopter method. However, while less costly, such measurements have most of the same issues.
RW: HD Radio is becoming available to more listeners every year due to new car sales. For a station wishing to provide good coverage for a supplemental HD2 channel, what would you recommend in terms of system design and injection levels?
Vernier: Most new HD transmitters being installed today will use low-level injection of the HD carriers. High-level injection, once in common use, is no longer wanted, because high-level combining wastes energy, increasing the cost of running the transmitter.
In general terms the quality of the HD2 signal depends on the overall signal strength of the analog portion of the signal and the amount of injection of the HD signal. Dropouts occur with IBOC transmissions when the signal level drops due to terrain blockage, and in some cases interference from other stations.
It is unfortunate that when listeners to HD2 or other multicast channels lose signal the radio has no backup, such as in the case of HD1, and it simply goes to silence. When the FCC gave stations permission to use IBOC, initially stations went to an injection level of –20 decibels over carrier level, which is 1 percent of the licensed power. Stations uniformly found that the HD injection level covered a smaller area than the analog coverage. When the FCC allowed –14 dBc injection many stations found that the match was almost the same as the analog coverage. In cases when a special showing of no interference to other stations is presented to the FCC, stations are allowed –10 dBc injection. Many of these stations report that their HD2 signal goes as far, or further, than the analog.
RW: Is it possible to use same-frequency boosters to improve the coverage of a station that might be terrain-blocked for part of its licensed coverage area?
Vernier: Yes, absolutely. However, misplaced boosters can also be more destructive to a given station’s signal. In the case of a booster that is placed to overcome a large terrain obstacle that totally blocks the signal between the booster and its primary station, the booster can be installed so it compensates effectively for the loss of listeners. However, in the situation where the terrain blockage interrupts the signal over only a part of a station’s signal area, and a booster is installed that covers both the terrain blocked area and the unblocked area, serious interference can result in the unblocked area. To the listener, the interference manifests itself as garbled audio or picket fencing.
Due to the time the signal travels from the primary station to a given listener and the time it takes for the signal to travel from the booster to the listener, the phase of each signal will not be identical. While the process of synchronizing by delaying the booster signal can correct the interference at the listener’s location, other areas that are off-angle of the direct line to the listener will not have synchronization. If those areas that are out of sync are unpopulated and the populated areas where synchronization can be accomplished are targeted by the boosters, coverage to important terrain blocked areas can be achieved.
Installing a booster in an essentially flat area can be challenging because there will always be areas where synchronization cannot be achieved. It is said that more boosters have been installed and then promptly turned off than those that are licensed and operating due to the interference and synchronizing issues.
There are several computer programs available to the cellular community that deal with this issue, however not many for use by the broadcaster. The only program I am aware of is the V-Soft Communications’ booster module packaged that is an option with the Probe 4 propagation analysis program. This program will allow the user to adjust the booster or the primary station’s timing delay, threshold for interference in dB, maximum allowed timing delay for interference reception, and the front-to-back ratio for the receiving antenna. Based on the inputs, the program will graphically plot the areas where interference is predicted to occur.