Count Every Penny – 2003 Salary Survey
Oct 1, 2003 12:00 PM, By Kari Taylor, associate editor
Frugal or cheap, conservative or tightfisted. Call it what you like,but keeping track of your money is sound financial advice, especiallyfor those on a budget.
This year’s salary survey is intended to help you, the radioindustry professional, maintain your income better by providing salaryinformation for various market sizes and job titles.
Financial Facts
Each year, the Radio magazine-exclusive survey is conductedto determine the latest salary trends. In June, e-mailed invitationletters containing a link to a survey were sent to more than 3,700Radio magazine subscribers, who were selected on an nth namebasis, among radio station and network subscribers.
The results of the study are presented by job title group and marketrank (Top 50 and Below Top 50). Where appropriate, medians have beenpresented for numeric responses. The median represents the middlevalue, or the point where half of the responses lie above and half ofthe responses lie below the value.
The information gathered in the survey is intended to illustratebroad trends in the industry. Treat the data as a starting point forsalary ranges. Factors such as cost of living and the demand for aparticular job are also important in determining salary range.
Estimated Median Salaries for StationManagement. Salaries in large markets appear to have decreasedslightly in 2003, while there appears to be an increase in small marketsalaries in 2003.

22
Number of years the typical respondent has worked in the broadcastengineering industry.
Estimated Median Salaries for StaffEngineers. Salaries in both markets appear to have decreasedslightly in 2003.

27.3
Percentage of station chief engineers who have worked in thebroadcast engineering field for 30 or more years.
9 Number of years the typical respondent has worked in his orher current position.
Contract Engineers earn an averagehourly rate of $45 and bill an average of 18 hours per week. Contractengineer respondents are fairly evenly distributed between large andsmall markets.

8
Percentage of VP/GM/station managers who have worked in thebroadcast engineering field for less than five years.
20.1 Percentage of respondents in the Top 50 market that havebeen at their current position for 6 to 9 years.
Less than half of all respondentsreceived salary increases in 2003.

48.5
Average age of the typical radio industry respondent.
16.6 Percentage of total respondents that are responsible forfour to five individual stations (AM or FM).
Salary Increase%2%2.1%-3%3.1%-4%4.1%-55.1%-9%10%+Mkt/Reg Dir/CorpEng10.5%31.6%21.1%15.8%5.3%15.8%Station ChiefEngineer21.6%39.2%13.7%17.6%7.8%0%Station StaffEng/Tech21.4%39.3%17.9%10.7%0%7.1%VP/GM/StationMgrs4.2%20.8%25%25%16.7%8.3%OperationsStaff/Mgrs36.4%9.1%18.2%18.2%9.1%9.1%ContractEngineers14.3%21.4%7.1%7.1%14.3%21.4%
Distribution of salary increases by jobclassification. Of those respondents that received a salary increase in2003, 21.6 percent of station chief engineers received a 2 percent orless raise, while 21.4 percent of Contract Engineers received a 10percent or more increase.
3
Number of radio stations respondents are personally responsible for(AM or FM) on average.
SBE certification pays off for staffengineers. Staff engineers with SBE certification earned significantlyhigher salaries than those without SBE certification.

18
Percentage of respondents in the Below Top 50 market that have beenat their current position for 4-5 years.
More Info Online –
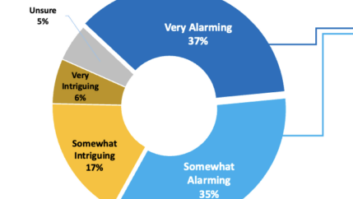
Survey respondents were also asked for feedback about IBOC and itsimplementation into their radio station. Find out what respondents hadto say atberadio.com/ar/radio_survey_responses_iboc/index.htm.
Copies of the complete survey are available for purchase at $75each. Contact Kari Taylor at[email protected]or 913-967-1786 toorder a copy.