Glynn Walden touts a new methodology for presenting am coverage data.
An interesting technical concept – one that didn’t get a lot of attention when it was presented last fall -was a study of signal levels and interference in the AM band. It was advanced by Glynn Walden and titled “New Methodology for Presenting AM Coverage and Interference Data.”
The new study methodology emphasized listenability or Quality of Service (QOS) as the factor determining the point at which listeners tune out and where that will occur within the service area.
Walden said the methodology, when combined with “subjective evaluations producing Mean Opinion Score (MOS) ratings, can be effectively used to determine ‘true’ AM coverage by relating listener acceptance to specific ‘cells’ in the grid.”
He said he hopes this approach will allow station owners to understand more completely the real-world “fate” of their signals than that seen with simple contour analysis. The effects of co-channel and adjacent channel interference, including night-time skywave effects, may be graphed clearly with this grid-based computational method.
Walden made his presentation at the fall NAB Radio Show prior to accepting his current job as senior vice president of engineering for Infinity Broadcasting. He is familiar to the industry also for his work at Ibiquity Digital in the development of IBOC.
Structured grid
The methodology utilizes the “FCC’s accepted rules and propagation models to produce an AM grid-based analysis of coverage and interference during day and nighttime receiving conditions,” he said.
“While computationally more expensive than contour analysis, the methodology uses a structured grid approach that produces data with a fine degree of granularity which is much better for computing combined groundwave and skywave signals.”
He called the approach ideal for determining signal and interference for any location across the United States and for analyzing population and other statistics of the entire frequency band.
“These advantages combine to produce a model of the AM allocation scenario that can be used to produce many different quantitative metrics and conclusions concerning the existing levels of interference and how that may change with the introduction of new services.”
Showing maps generated by his studies, Walden stated, “Look at the noise floor across the U.S. That is why the AM channel is noisy or interference-prone. The co-channel eats ya before the first-adjacent ever gets ya!”
(click thumbnail)Fig. 1
Walden said most radio stations, with the exception of the clears, are not limited by first-adjacent interference but by co-channel interference! See Fig. 1. This most disturbing form of interference, co-channel, results in listeners hearing two stations at once.
“The effects of two sources of overlapping audio are extremely disconcerting,” Walden said. These conditions cannot be reduced through receiver design. Co-channel interference is the dominant source of degraded QOS under nighttime skywave conditions.
Too much noise
In preparing the studies to ascertain the effects of introducing new services into a broadcast band and their influence on QOS, a number of existing conditions needed to be evaluated.
These were the levels of the existing signals, the levels of interfering signals on co- and adjacent channels, the effects of these signal levels on the quality of reception on existing receivers, and, most important, the relationship between the listenability (QOS) and channel conditions.
(click thumbnail)Fig. 2
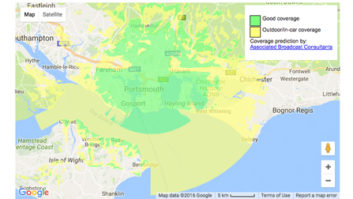
At what point of reduced QOS will the listener tune out? Where is there too much noise. Where will that occur in the service area? Referring to the color code of the maps, it is through the blue to green areas where tuneout occurs. See Fig. 2.
“In this study, a 410 x 901 element grid was drawn over the entire continental United States, based upon a 4-minute interval in latitude and longitude,” Walden explained. “The total groundwave and skywave signals from all nearby, relevant stations were computed at each point on the grid.
“The study resulted in the ability to produce color-coded tiled matrix maps for every U.S. broadcast licensed AM station depicting: 1) Total RSS’ed groundwave for daytime and total RSS’ed groundwave and skywave signal strengths for nighttime 2) The co-channel D/U (desired-to-undesired) ratios, 3) The first-adjacent-channel D/U ratios and 4) The second-adjacent-channel D/U.
(click thumbnail)Fig. 3
“The technique, when coupled with subjective listening measurement, has produced various Quality of Service maps with the data presented in tiled cells of Mean Opinion Scores (MOS).” See Fig. 3.
Granular
Grid-based analysis, Walden said, produces data with a fine degree of granularity that is more suitable than contour analysis for computing combined groundwave and skywave signals and determining signal interference for points all over the United States.
“Grid-based mapping produces data that can be combined with other metrics to produce quantitave/qualitative analysis of a station’s coverage – its QOS at a given location,” he said.
“This study used the FCC’s accepted ground wave and a 50 percent skywave propagation model adapted to grid based analysis. The decision to use 50 percent skywave curves rather than the FCC’s 10 percent curves was made as it was assumed that a large number of interferers would typically be involved and that 10 percent curves would over-report interference.”
(click thumbnail)Fig. 4
A station’s programming format will affect first-adjacent interference as a talk format typically exhibits narrower bandwidth than a music format and will impinge on the station suffering the interference to a lesser degree, he said. In addition to co-channel interference maps, first- and second-adjacent-channel interference maps were generated by calculating the desired station’s groundwave signal D (desired) to the combined upper and lower adjacent interference signals U (undesired) resulting in a D/U ratio map. See Fig. 4.
The characteristics of existing receivers are an important factor affecting QOS. AM receivers with a wider IF bandwidth are more susceptible to adjacent-channel interference. Inexpensive receivers obviously fall in this category; however they must be included in the study as they probably comprise the majority of receivers.
Walden said he expects that QOS can be generated by subjectively evaluating the existing base of receivers. The broadcast community, through the NRSC, has gained a great deal of expertise in using MOS scores for audio quality determinations, he said.
“When the results are made available of subjective MOS ratings vs. interference, this study can then be extended to show coverage as a function of QOS in the tiled matrix grids.”
The grid maps accompanying this article are of objective signal interference and do not yet include these subjective ratings.