iStockphoto/Onur Döngel In my experience, a significant part of what we call “broadcast engineering” is, in fact, technical risk mitigation.
As engineers, we seek to prevent outages at the product generation and delivery chain we call a radio station. This means we build various systems that allow our stations to switch automatically or manually to one or another kind of alternate facility.
Most of us see this as a primary responsibility. We plan and provide for backup transmitters, backup studios, backup links from studio to transmitter and other similar facilities. There are systems that duplicate existing, working installations and add no function or value except added reliability. All consume precious capital and operating expense.
Relatively little emphasis is placed on reasoned expense analysis, particularly where it elevates the risk of interruption of the product.
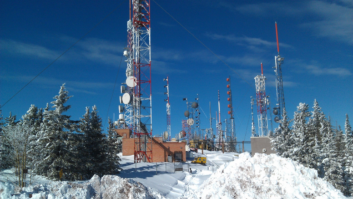
Recently, I visited a station and toured with its chief engineer while he explained the station’s workings. This facility had no fewer than five separate, redundant systems for delivering audio from the downtown studios to the transmitter and tower.
Of these, at least two rode on facilities leased from the telephone company. Another two likely carried antenna rental expense. The fifth was, as I recall, an Internet-based last resort scheme. It presumably runs on an Internet connection that the station would maintain anyway.
Obviously, one link from studio to transmitter is a requirement of being in business at all. But at this particular station, redundant paths two through five consumed capital expense at installation. Two, three and four will consume operating expense for as long as they remain available.
What if we looked at such systems as a kind of insurance policy (which they really are)? They “insure” against the risk of product interruption. This begs the question: How many insurance policies are necessary and what is the actual value of the risk they insure?
BLAME GAME
In my experience, stations rarely do this kind of analysis. As station engineers, we’re partly to blame. Because we generally own our responsibilities toward the functionality of the stations we serve, we sometimes personally take on failures that are simply inescapable statistical realities. And because, in many cases, we are the only individuals who know how the systems work, so our co-workers look to us instantly when an outage occurs.
When everyone’s livelihood and involvement comes to an abrupt stop when the broadcast delivery system fails, all eyes are on us. If failures extend beyond a few minutes, we begin to project feelings of “maybe our engineer isn’t as smart as we all thought he/she was,” and this isn’t pleasant.
No one likes to be the center of attention when that attention is negative.
I believe this drives a decision-making process that overstates the risk of outage and places excessive weight on deployment of redundant facilities. This wastes money which could be better deployed elsewhere.
A second motivation is the feeling of pride experienced when the systems we’ve built solve the problem. And if, while sitting at your computer in your bathrobe, you can correct any failure by remote control, that’s certainly preferable to being hauled out into the cold, dark night for a trip to the radio station, all the while listening to static on your frequency.
That’s how we engineers get to a place where there are five layers of redundancy and the business is burdened with the attendant expense. Our profession would benefit from a more arms-length approach to business decision-making.
For any such analysis, the starting point is an assessment of the reliability of the core system. This provides data on the likelihood that we’ll have to file a “claim” on our insurance, which in this case means falling back to a redundant system.
SCENARIO EXPERIMENTATION
First, identify the core elements of your content origination and delivery system. Then, use any available historical data to try to reasonably model what is a “typical” outage. For systems that live entirely within the station, such as the studio equipment, transmitter, antenna and related devices, look back through your memory (or logs) and try to develop a reliability quotient for each required sub-system.
This quotient is the uptime divided by the total time. Reliability of the whole system is the product of each chained sub-system’s individual reliability.
Is your content generation and delivery system a .99999 (five-nines) performer? This means, on average, you’ll experience less than six minutes per year of downtime. That’s a high standard. AM stations that change pattern twice daily probably fail this level of reliability. Overall system reliability of .9999 might be a more reasonable goal.
In any event, each component in the delivery chain deserves analysis. Where redundancy is present, assess both (all) systems independently. The statistical rule for redundant systems is to multiply the probability of failure for each redundant component (i.e., 1 minus the reliability quotient), and then subtract this overall product from 1.
Say you have a microwave STL with reliability of .999 and a backup Internet-based link with reliability .95. The potential for failure of the microwave is .001 (1 minus .999) and the potential for failure of the backup is .05 (1 minus .95). The product is .00005 and the combined reliability quotient (1 minus .00005) is .99995.
(This is the probability that both systems will be unavailable simultaneously. As you can see, a little insurance goes a long way.)
Use these reliability quotients to determine the likely lost airtime for any given time span. Add an appropriate value for the time required to respond to the failure, in the event that manual intervention is required.
I’ve used STLs as my example here, but the principle applies universally. Make use of quoted reliability specifications where available (like from your T-1 provider, for example), and estimate from experience and intuition everywhere else.
Pay particular attention to sub-systems that share components. For example, if you have both T-1 and leased equalized loop services from the telephone company, both would fail if a cable is cut or the associated central office switch is disabled.
A spreadsheet is well suited to this analysis and serves to be a living document that will identify issues and allow reasoned planning. Best practice might be to bracket the outage expectations for high and low into two categories, based on this analysis: The total outage expectation over time and the anticipated length of any particular outage.
Next, attention should be directed to the impact of outages. This assessment should take into account all value and revenue factors. Perhaps missed spots can be made up, perhaps not. Revenue associated with program-length content may be forfeited in whole or part. These impacts should be reasonably quantified and perhaps graphed across the station’s typical week.
DAYS, HOURS, MINUTES
This is analysis best done with the help of the general managers and sales managers, because revenue analysis can be something of a touchy subject at many stations. Start with annual top-line revenue and dissect it both seasonally and by day and daypart.
The latter is obvious, but seasonal trends impact exposure as well. Suppose an ice storm takes out power in the weeks prior to Christmas. This might put generator availability ahead of several other redundancy strategies. Or maybe not. Your results will and should vary.
Ideally, you should connect the revenue and outage risk information on the same spreadsheet. Outage risk metrics are used to predict outage time, which then is applied to revenue. Consider tabs for separate categories of revenue or risk, perhaps dividing by daypart or any other reasonable criteria.
For example, your station may be staffed more fully at some hours than others. This might increase outage response times for failures that require human intervention, or make spot revenue less recoverable. Once you’ve built your model, you can begin doing some “what if” analysis towards the goal of best reliability and lowest expense.
These will probably be mutually exclusive goals, but hopefully patterns will emerge. At the very least, this qualifies as useful due diligence in which spending is planned or savings are proposed.
IRREPLACEABLE?
Finally, avoid letting hubris influence decisions.
It may come as a surprise, but in this day and age, I believe no radio station provides an irreplaceable service. Given the difficulty of inducing listeners to change a radio preset, I also believe no outage will significantly diminish listener loyalty. Outage experiences can be dispiriting to staff, but are forgotten soon, provided they don’t become a pattern.
These are just my opinions, of course, and should be part of the discussion and strategy for each station that does the reliability analysis I recommend. Perhaps your station bills $30 million a year. In that case, outages are more concerning than the station that bills only $1 million.
And “insurance,” in the form of hardware and fixed expense, cost about the same for both. Thus the decision for each would be different, but the analytic techniques remain the same. Identify and quantify the risks, assign a value, then allocate solutions accordingly. The larger goal should be a collaborative approach to reasoned risk assessment and wise allocation of resources.
In the end, this will result in a stronger, more secure broadcast enterprise.
Comment on this or any story. Email [email protected].
Frank McCoy is the former vice president of engineering for Gulfstar/Capstar, executive vice president and later chief executive officer of American Media Services LLC. He is in his “retirement job” as chief engineer for Salem’s two AM stations in Chicago, WIND and WYLL.