Here’s a situation that creates fear and trembling: The engineer receives a call from the radio station: “The transmitter is off the air and there is a VSWR fault.”
If the station is fortunate, the engineer will receive a follow-up call some time later with the news “The ice melted, everything is normal.” If the station is unfortunate, the station remains off the air until major repairs are completed.
What in the world are SWR, VSWR, reflected power and return loss? Why do they matter? And what can be done if there is a problem?
This article and a sequel in February 2016 are an attempt to explain some of the mysteries about SWR, VSWR, reflected power and transmission systems without resorting to extensive formulas. We won’t attempt a thorough mathematical analysis of the subject; but that is not to minimize the importance of the transmission line formulas. I encourage you to pursue this subject online for more information.
EFFICIENT TRANSFERS
RF systems depend upon the efficient transfer of power from the transmitter to the load (usually, the antenna). Unless the transmitter is located directly next to the load, a transmission line will connect one to the other.
If the load on the end of the transmission line is a pure resistance of the same value as the impedance of the line, the transmission line will appear to be infinitely long. If the load is not a resistive load that matches the transmission line, there will be a reflection from the load. This reflection is referred to by different names: reflected power, Standing Wave Ratio (SWR), Voltage Standing Wave Ratio (VSWR) or return loss. All of these terms imply there is power being reflected from the load, but they describe this reflection with different values.
SWR results when the reflected power interacts with the forward power to create standing waves in the transmission line. These standing waves have a voltage maximum and a voltage minimum, as well as a current maximum and a current minimum. The voltages and currents can be measured with the appropriate test meters. When we discuss the ratio of a maximum and minimum voltage in the line, the term VSWR is appropriate. When we discuss the minimum and maximum current in the line, the term Current Standing Wave Ratio (ISWR) is appropriate. For most practical purposes, VSWR and ISWR are identical in value.
SWR can be calculated from the formula:
![\[ {\text{SWR}=\left(\frac{1+\sqrt{\frac{P_{r}}{P_{f}}}}{1-\sqrt{\frac{P_{r}}{P_{f}}}}\right)\ \]](https://www.radioworld.com/wp-content/ql-cache/quicklatex.com-3edbaea448708f9270e3b6291c25014d_l3.png "Rendered by QuickLaTeX.com")
Where:
Pr = reflected power
Pf = forward power
OR
![\[ \text{SWR}=\frac{E_{max}}{E_{min}} =\frac{I_{max}}{I_{min}} \]](https://www.radioworld.com/wp-content/ql-cache/quicklatex.com-8a1c96a4357ccd1351358001fc75405b_l3.png "Rendered by QuickLaTeX.com")
Where:
Emax = RMS maximum voltage of standing wave
Emin = Minimum voltage of standing wave
Imax = Maximum current of standing wave
Imin = Minimum current of standing wave
As you can see by the final expression, SWR and VSWR and ISWR are equal.
The smaller the ratio, the better the match between the load and the transmission line. Thus, a 1:1 ratio indicates there are no standing waves and the load is a perfect match. A 1.1:1 VSWR means that if there were 10,000 watts transmitted, the reflected power would be about 23 watts. A VSWR of 2:1 means that with 10,000 watts transmitted, about 1,111 watts is reflected back towards the transmitter. If 100 percent of the transmitted power is reflected, the VSWR is infinity.
Return loss is another term used to describe the amount of power being reflected from the load. Return loss is expressed in terms of dB.
![\[ RL=10\log\left(\frac{P_{f}}{P_{r}}\right) \ \]](https://www.radioworld.com/wp-content/ql-cache/quicklatex.com-b5279c6658e61d4c724edd1fc6491526_l3.png "Rendered by QuickLaTeX.com")
If 10,000 watts is transmitted and 23 watts reflected, the return loss is 26.4 dB. The larger the absolute value of the return loss, the better the match between the load and the transmission line. A perfect load with no reflected power would result in a return loss of infinity.
The reflected power from a bad load will put additional stresses on the transmission lines. As an example, if the normal transmitter power is 10,000 watts and the load has a VSWR of 1.05:1, the maximum RMS voltage in a 50-ohm transmission line will be 725 volts with a peak voltage of 1,025 volts. If the load goes bad and the VSWR increases to 10:1, the maximum RMS voltage will be 2,236 volts while the peak voltage in the line will be 3,162 volts. Using Ohm’s law, the normal maximum current will be 20.5 amps. If the VSWR increases to 10:1 the maximum current will be 44.7 amps.
![\[ E_{max} =\sqrt{P_{f} \times Z_{o} \times \text{SWR}} \] \[ E_{peak} =E_{max} \times 1.414 \] \[ I_{max} =\frac{E_{max}}{Z_{o}} \]](https://www.radioworld.com/wp-content/ql-cache/quicklatex.com-efab22ac027ea322cbdea9474d131662_l3.png "Rendered by QuickLaTeX.com")
Where:
Epeak = Peak voltage of maximum voltage of standing wave
Imax = Maximum current of standing wave
VSWR not only affects the efficient transmission of power but can have a severe effect on the transmitted audio. As a result of a mismatch, there is a portion of the RF signal that is reflected back towards the transmitter. When this reflected signal reaches the transmitter, it is reflected back towards the load. This reflected signal is delayed in time and shifted in phase from the original signal. This delayed RF signal will also be transmitted. In the receiver, the delayed RF signal will interact with the primary signal to reduce the audio quality of the station. This is exactly the same effect that is produced by multipath. You can see the effect of increased VSWR on an analog TV station as ice builds up on a TV transmitting antenna. As the VSWR increases, you will see ghosting in the received video.
Another effect of a mismatched load causes the transmission line to act as an impedance transformer. The transmission line will transform the load impedance into another value. This value is dependent upon the length of the transmission line. The most extreme example is the quarter-wavelength length of transmission line that is terminated into a short. The other end of this line will be an open circuit to the transmitter. If the line is terminated with an open, the input to the line at the transmitter will become a short. This effect can be used to good advantage and will be discussed in conjunction with the Smith Chart in my subsequent article.
MEASURING VSWR
Now that we have a basic understanding of VSWR, we need to consider its measurement.
FM broadcast transmitters have a metering system that is used to measure both the transmitter power output and the reflected power of the transmission system. The metering system uses a directional coupler to sample the reflected and forward signals at the output of the transmitter. This sampled RF signal is rectified and drives a meter or other indicating device. There may also be a station-installed directional wattmeter inserted at the output of the transmitter.
The accuracy of the metering system is dependent upon the accuracy of the individual components of the system. If any value should change, the accuracy of the meter will change. Another factor to consider is that the power meter on many transmitters has a calibration potentiometer. This potentiometer is subject to misadjustment. All of the components are subject to lightning damage.
The external wattmeter that is present at many radio stations has a directional element in the sample section that can be rotated to provide a forward power reading and a reflected power reading. The accuracy of this meter is typically 5 percent at the full-scale reading. This means that for the highest accuracy, the sample element should be selected to provide as close to a full-scale reading as possible for normal power. Because the normal reflected power is much smaller than the forward power there should be another sample element available for measurements that is at least 10 dB lower in value than the forward sample element.
Another source of error in determining VSWR is the loss of the transmission line. The power meter is normally installed at the input to the transmission line. At this location, the power meter is reading the power output of a transmitter a few feet away. But the reflected power is coming from a location that may be several hundred feet away. This will result in the VSWR reading being inaccurate and lower than the actual value.
As an example, consider a transmitter that is feeding 10,000 watts into a 3-inch transmission line that is 500 feet long. At 100 MHz, the loss is 0.14 dB per hundred feet. The input to the antenna will be 8,511 watts. If the antenna reflects 250 watts the VSWR at the antenna will be 1.41:1 with a return loss of 15.3 dB. But the meter at the transmitter will show a VSWR of 1.34:1 or a return loss of 16.7. The reason the meter is reading a different value than the actual value is that the power meter is measuring the forward power that is not attenuated by the transmission line, while the reflected power has been attenuated by the line. The 250 watts that has been reflected is now 213 watts at the power meter.
RED FLAGS
Pay attention to any change in the VSWR, whether it increases or decreases. We all understand that when VSWR increases that may be a bad thing but a VSWR decrease at the test meter may also indicate a problem. Something in the system has changed; perhaps the transmission system has a problem or it may mean the metering system has changed. If a second directional wattmeter is installed in the system a cross check can be made to determine if the transmitter metering system is defective. If you have an external wattmeter with plug-in elements, keep spare elements and use them to verify your readings.
Before you call in the consulting engineer and tower crew to investigate the antenna system, here are a few things you can check on the ground to help determine the cause of the changed VSWR.
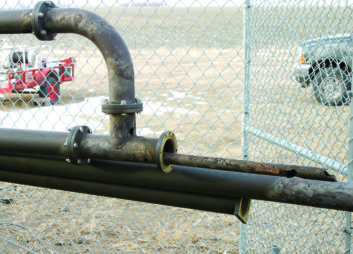
Has the VSWR metering system been checked against a known good system? If any component in the power metering system has been changed, the calibration is no longer accurate. If the transmission line is pressurized with dry air or nitrogen, is the line still holding pressure? Fig. 1 shows the damage on a line from a failure to maintain pressure. Don’t assume the line is pressurized by using the gas pressure gauges. Remove the gas fitting from the transmission line and listen for the hiss of escaping gas from the transmission line. If the line does not hold pressure, check all of the connections on the ground before having a tower crew on site. Verify that the pressurizing gas is indeed dry. Is there icing in the area? Icing may be occurring higher on the tower and not on the ground.
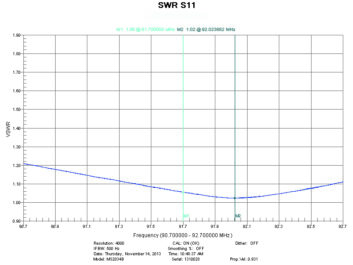
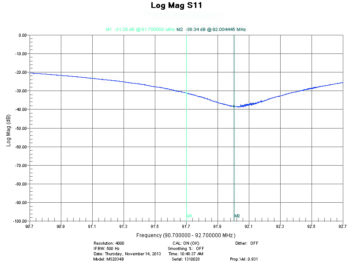
The reason VSWR may decrease with icing on the antenna is that many antennas are tuned so the minimum reflected power is for a frequency slightly higher than the operating frequency of the radio station. When the antenna begins to ice up, the antenna elements are lengthened, resulting in a better match at the operating frequency. This shows up as reduced VSWR. If the icing continues, the VSWR will begin to increase as the ice continues to increase the size of the antenna and decrease its tuned frequency. Fig. 2 shows a VSWR measurement where the antenna is tuned so the lowest VSWR is higher than the transmitting frequency. As ice accumulates, the minimum VSWR will gradually shift lower in frequency. Fig. 3 shows the same measurement but in a return loss format.
Once it has been determined that the VSWR change is real and not caused by icing, move on to the following easy but important test: Check the temperature along a length of transmission line going to the antenna. If high VSWR is present, you’ll find voltage peaks and current peaks every half-wavelength along the line.
These high current points will cause heating in the line that can be checked easily with an infrared thermometer, or even your hand. The best place to check the line is from the output side of the last power meter sample section and as far along the line as you can go, but at least 15 feet. This test may even help locate the problem if it is in the line before it goes up the tower. Fig. 4 shows an example of a burned transmission line, initially discovered by the hand sensing method. After the outer jacket was removed, the burning and discoloration due to overheating was exposed. This turned out to be another case of a failure to maintain dry air or dry nitrogen in the line. Over a period of months, water accumulated in the line and caused a short.
If everything on the ground has checked out okay, you’ll need some more sophisticated test equipment. There is a variety of test equipment available for purchase or rental that will help you locate the problem. While it is beyond the scope of this article to detail these options, they include time domain reflectometers, RF network analyzers and spectrum analyzer-tracking generator combinations used with a calibrated directional coupler section.
For more information on this subject, browse “The ARRL Antenna Book for Radio Communications,” which contains a good chapter on transmission lines. Another source of information is “VSWR Measurements Using In-Line Power Meters” by Tim Holt of Bird Technologies Group.
A future article will provide a high-level explanation of the use of the Smith Chart. While the Smith Chart is initially intimidating, once you have used it you can begin to see its value. For an introduction, I suggest browsing to http://tinyurl.com/rwee-smith.
Mike Hendrickson, CPBE, CBNT, has been a broadcast engineer for more than 45 years. He is chief engineer of American Public Media Group in St. Paul, Minn.