In the not-so-distant past, contractors and consultants who wanted to check parameters at a number of FM stations had to lug around a frequency-agile FM monitor and related gear. Today, DSP technology enables one to do the same things with a small box connected to a laptop.
One such device is the MicroGen TS9085 FM Modulation and AF Spectrum Analyzer. A predecessor, the TS9000A, received RW’s Cool Stuff award in 2004, so I decided to check it out.
My review device was provided by Sierra Multimedia of Bella Vista, Ark., a U.S. distributor for the product, which is made in the United Kingdom. (I tested a TS9080; the company recently added a couple of features, as noted below, and calls it the TS9085.)

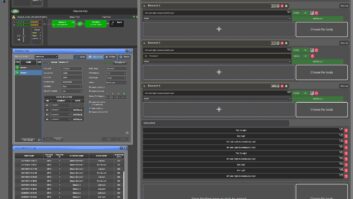
A spectrum analyzer displays stereo pilot and RDS information. The enclosure is a robust dual-chamber aluminum extrusion. End panels have connectors for balanced audio out, headphones, USB, antenna and IF inputs, RF, IF and alarm outputs. The look and feel of the unit speak to high-quality mechanical engineering.

This 2D display visualizes stereo quality. Calibration-free
Inside the analyzer is some high-stepping technology. At the core is a digital phase FM demodulator. It features two feedback loops that maintain accuracy over time and temperature by comparing deviation amplitude and phase to a 20 ppm voltage reference band gap diode, making the analyzer virtually calibration-free.
Measurements of deviation, modulation power, pilot level and RDS subcarrier are referenced to this, as are baseband measurements made with the spectrum analyzer.
The 10 Hz–100 kHz FFT spectrum analyzer has 16-bit sampling and a 100 dB dynamic range, which can be extended to 110 dB with waveform averaging. This allows signals below the noise floor to be observed and measured.

Stereo monitor. The time base can be set as desired, with vertical gain at X1 or X10 for detailed inspection. The stereo signal is decoded by a software algorithm. The 19 kHz pilot is detected and phase locked to a narrowband filter. The left and right channels then are extracted with a synchronous detector, resulting in excellent phase matching between channels. The extracted audio signal then is passed, via Windows, to the sound card for audio monitoring.
Installation of the iLog software can come from either a CD or MicroGen’s Web site; iLog works with Windows 98, Me, 2000, XP, Vista and Windows 7. The recommended system is Windows XP/Vista/Windows 7 on a 2+ Ghz Pentium/Athlon.
The unit is powered from the USB port. However, my Dell Latitude laptop did not provide enough juice to power the analyzer. This is a known issue, and the instructions suggest powering the unit with an externally-powered USB hub. This works, but sacrifices some of the unplugged portability of the analyzer.
Analysis tool
The first step with the 9080/9085 is usually to connect an antenna and do a frequency scan, although you can dive in and do a single channel analysis.

Sixteen RT messages can be displayed on iLog, with an unlimited number stored to hard drive. No antenna is provided, but I found a telescoping whip antenna with a BNC connector worked well. Note that autoscan will run indefinitely, and you must manually stop it after two or three sweeps through the spectrum.
One of the features claimed for the auto scan function is automatically displaying a station’s PS name. Despite the fact that many area stations had this working with their RDS, this information would not display in the frequency scan. “BBC London” popped up on one of the local signals at 94.9. The company explains that the analyzer leaves the factory pre-tuned to this. This will be deleted when running AutoTune for the first time.
My efforts to input station information manually often resulted in the text being assigned to the wrong signal.
The analyzer is fussy about multipath, as evidenced by the digital readout and multipath display. Making measurements with high multipath is a waste of time, as false high modulation levels, inaccurate readings and garbled RDS data will result.
Although I had access to several rooftops, the prospect of lugging a long extension cord to power the analyzer and laptop proved tiresome. Picking the right spot in advance seems critical to successful multi-station analysis.

A small segment of the spectrum is shown at 10 kHz resolution. Note garbled information for 91.7. The digital readout gives the frequency and signal strength of the channel tuned. For strong signals, a user-settable attenuator can be selected with settings of –10, –20 or –30 dB. As with all displays on iLog, the scan can be copied and pasted into any application via the clipboard.
The unit features a robust RDS decoder that can decode virtually all groups and display this data on-screen as well as storing to a hard drive. The most recent 16 RT messages are displayed in the RT window. Any number of RT messages can be saved as ASCII text to the hard drive. RDS quality can be displayed to four decimal places, although it is not explained how this statistic is created.
While most users will utilize the analyzer’s FM functions, it is worth noting that the spectrum analyzer works in the audio range, making it useful for white or pink noise analysis.

The frequency deviation histogram provides the best way to assess deviation levels over longer periods of time. In addition to being a great analysis tool, the unit’s headphone and audio outputs provide for some incredible listening. Monitoring with a good pair of headphones reminded me how great analog technology can sound when everything in the FM air chain is done right.
Quirks
While this is a well-engineered piece of hardware, it is not without its issues.
Most notable is the poor documentation. What little I found is vague; I ended up learning how to use the analyzer by trial and error. The capability to monitor alarm parameters and do basic remote control using the iLog software with text commands is mentioned in the documentation, but not explained. The factory folks note that there is a Help file accessible from the application that details operation, and they tell me that the supplied CD now comes with a PDF file explaining in detail how to operate remotely.

With the release of iLog Version 5, it is possible to log the position of measurements taken. The software will scan the PC for any NMEA GPS device attached and produce files that can be displayed on Google Earth, showing signal strength and other measurements. The iLog software will not run without the analyzer attached, making it impossible to look at past data without being connected. Switching color or brightness settings caused the analyzer to jump to another station. According to MicroGen, this only occurs if the frequency is not saved; switching color automatically reselects the preset network.
Despite some quirks and the less-than-stellar documentation, I enjoyed working with this unit and wish I’d had more time to explore its alarms, remote capabilities and other features.
Product Capsule MicroGen TS9085 FM Modulation and AF Spectrum Analyzer
Thumbs Up
- + Robust RDS analysis
- + Potentially unplugged operation
- + Remote control with simple text file commands
- + Flawless audio for monitoring
Thumbs Down
- – Documentation
- – RDS PS with autoscan doesn’t work
- – Cannot run software without attaching analyzer
- – Glitchy software jumps to different signals
Retail
$2,725
For information contact Sierra Multimedia at[email protected]or visitwww.microgenelectronics.com. MicroGen emphasizes that the baseband spectrum analyzer, first introduced six years ago, allowed engineers to actually see as well as analyze and measure the signal coming from their transmitter. “Previously this would only been possible with a $20,000+ HP analyzer,” a spokesman said, adding that this is likely a reason the original earned awards at the time.
The company also notes that with the release of iLog Version 5, it is now possible to log the exact position of any measurements taken. The software automatically will scan your PC for any NMEA GPS device attached and produce files that can be displayed on Google Earth, showing signal strength and other measurements.
Note also that the TS9080 recently has been upgraded to the TS9085 with the addition of user-selectable wide- and narrow-band IF filters. An additional BNC connector now outputs a 57 kHz bandpass of the RDS signal. Current versions of the iLog software work on either unit.
For the contract engineer or consultant not as concerned with HD Radio monitoring, MicroGen’s TS9085 may be just what the doctor ordered.
Tom Vernon is a longtime contributor to Radio World.