IBOC Mask Compliance
Oct 6, 2011 11:33 AM, By Greg Best, PE
A hybrid signal has challenges, but one method simplifies the process.
Measurement of your transmitter’s hybrid FM IBOC mask for emission mask compliance is not a monumental task but requires some strategy and attention to a few key parameters. This article will walk through the process and identify those key parameters and give examples of steps throughout the process so the mystery is removed. With more than 1,600 FM hybrid IBOC stations on the air and 207 operating above the nominal -20dB power level, emission mask compliance measurements will become more important.
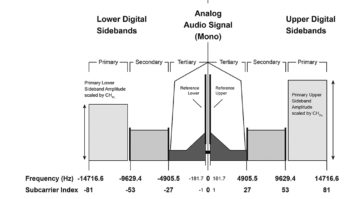
As a primer, it’s important to have some understanding of how a spectrum analyzer (SA) measures digital signals. So a small amount of introduction will first be devoted to this. First, let’s show the spectrum to be measured. Figure 1 shows a hybrid FM IBOC spectrum with no modulation on the analog signal.

Figure 1. FM hybrid IBOC signal without modulation. Click to enlarge.
The analog carrier signal level is a coherent carrier (bandwidth ~100Hz) so its displayed amplitude is not dependent on the resolution bandwidth used. However, as the SA sweeps through the IBOC signal, the amount of IBOC signal energy displayed is dependent upon the resolution bandwidth filter employed because the IBOC signal is essentially noise-like. This can be seen in Figure 1, as the blue trace uses a 1kHz RBW filter and the black trace utilizes a 3kHz resolution bandwidth (RBW) filter. It looks like the IBOC signal with the 3kHz RBW filter has a greater amplitude. Notice also that the noise floor of the SA has also risen due to the same reason. To determine the total power of the IBOC spectrum being evaluated, simply multiply the ratio of the total bandwidth of the spectrum to the RBW being used for display on the analyzer. For example, the power of the lower sideband signal of ~70kHz spectrum of the IBOC signal is 70 times the power of the power displayed using the 1kHz RBW filter (or +18.45dB).
There are a couple of other important factors associated with the SA setup. One is the type of detector selected. Most newer SAs have an RMS detector and this is the detector mode that should be used. If an older SA with a logarithmic detector is used, there will be a 2.5dB error introduced that must be accounted for. The video bandwidth (VBW) filter should be at least 10 times the RBW filter selected so that peaks in the baseband signal are accurately reproduced. If the SA has a channel power (CP) mode function, it enables relatively easy measurements to determine the power of the signal in a given bandwidth, which is a fundamental part of making emission mask compliance measurements. So, a word to the wise, use an SA that has both a RMS detector and a CP function and you will get reliable numbers and will not waste a lot of time.
– continued on page 2
IBOC Mask Compliance
Oct 6, 2011 11:33 AM, By Greg Best, PE
A hybrid signal has challenges, but one method simplifies the process.
IBOC basics

Figure 2. Combined transmitter configurations. Click to enlarge.
Hybrid IBOC transmitters either combine the analog and IBOC signal at some level and apply them to the antenna (called a combined configuration shown in Figure 2) or the analog and digital transmitter signals are applied separately to an antenna (called a separate configuration shown in Figure 3). Whichever configuration you operate will determine the steps necessary to measure compliance with emission masks.
There are two emission masks that are important to check for compliance: The FCC emission mask and the NRSC emission mask.

Figure 3. Separate transmitter configurations. Click to enlarge.
The FCC emission mask is defined in FCC Rule 73.317 and deals with the analog waveform. This article will focus on the NRSC emission mask. The NRSC emission mask definition and other important documents can be found at the NRSC website. NRSC-G201-A, An RF Mask Compliance Measurement Methods and Practice document was published in April 2010, providing guidance on how to demonstrate compliance. There are many ways to make compliance measurements and the benefit of the NRSC-G201-A document is that it simplifies the process, makes it easier to understand, and reduces the amount of time and measurement points for reliable compliance measurements.
– continued on page 3
IBOC Mask Compliance
Oct 6, 2011 11:33 AM, By Greg Best, PE
A hybrid signal has challenges, but one method simplifies the process.

Figure 4. FM IBOC transmission mask. Click to enlarge.
Figure 4 shows the FM IBOC NRSC mask and Figure 5 shows the comparison, at least in a graphical way, to the FCC emission mask. The documents associated with both masks are important to read and understand before doing the compliance measurements. Table 1 provides the NRSC emission mask limits expressed in dBc/kHz values.
Frequency offset relative to carrier (kHz)Level relative to unmodulated carrier (dBc/kHz) 100 – 200-40 200 – 250-61.4 – ((freq. in kHz) – 200) � 0.260 250 – 540-74.4 540 – 600-74.4 – ((freq. in kHz) – 540) � 0.293 > 600-80 Table 1. NRSC-5-B hybrid FM IBOC waveform noise and emission limits.

Figure 5. Comparison of FM hybrid mask and FCC mask. Click to enlarge.
The basic transmission system and setup of an emission mask measurement task is shown in Figure 6. For discussion, first assume a combined configuration is used. The hybrid IBOC signal is sampled using a directional coupler after all transmitter filtering to observe the signal. As seen by the diagram, measurements can be made into dummy load or the antenna. In general more reliable measurements are made into a dummy load.

Figure 6. Measurement setup for combined transmitter operation. Click to enlarge.
Measurement method
If you look back at the separate transmitter configuration in Figure 3, there is no place to monitor the combined signal, only the independent analog and IBOC signals. So what happens if you happen to be one of the lucky people using separate transmitters? Necessity is the mother of invention, and a simple but great idea was introduced: By utilizing a Combined Hybrid IBOC Measurement Package, known as the CHIMP, it essentially makes a combined transmitter measurement possible even though separate transmitters are used. As shown in Figure 7, a directional coupler sample from each transmitter with attenuation to isolate the signals from each other and to ensure the proper ratio is used. Those signals are fed to a 3dB hybrid and the output result is the FM IBOC hybrid signal. This allows accurate measurements that can be made as if a combined transmitter were used. The separate transmitter measurement configuration using a CHIMP is shown in Figure 7.

Figure 7. Measurement setup for separate transmitter configuration. Click to enlarge.
– continued on page 4
IBOC Mask Compliance
Oct 6, 2011 11:33 AM, By Greg Best, PE
A hybrid signal has challenges, but one method simplifies the process.
When the indicated measurement points are used and if there is not enough isolation between the transmitters in a separate transmitter configuration, or if the combined signal transmitter is not linear enough, you will see the unwanted signals products on the SA display. In reality, there is always some undesired energy there but the real question is whether that undesired energy is below the power limits identified by the emission mask. Because of modulation of the analog signal, the unwanted signals are further spread out in frequency.

Figure 8. Combined IBOC and modulated analog signal with undesired energy. Click to enlarge.
A real spectrum with analog modulation and undesired signals is shown in Figure 8. When this spectrum is observed, it can be due to one of two sources: Either the SA is being overdriven and causing the distortion or the distortion is really there and the transmitter is at fault. Here again, it is important to know how much total energy is being fed to the SA because you cannot determine that just by looking at the amplitude on the display.
Unless your measurement is near the SA noise floor, you can determine whether the analyzer is being overloaded by adding 5 or 10dB of additional attenuation. If the signal amplitudes relative to each other do not change when the attenuation is changed then the problem is with the transmitter.
Assuming this is not a problem, the steps to determine compliance with the emission mask are straightforward.
Connect the transmitter(s) to a dummy load and accurately measure analog power and digital power. If it is a combined transmitter, you will have to use the spectrum analyzer to ensure the digital power is correct. (Remember to set the analog power reference on the SA with no modulation on it.)
� Ensure analog to digital power ratio is correct and apply analog modulation � Optimize transmitter linearity if required and recheck power ratio. � Define the measurement points and bandwidths for the NRSC mask � Record data at each point using 1kHz RBW and SA channel power mode. � Apply any correction factors for bandwidth necessary. � Compare emission measurements to the NRSC emission mask.
– continued on page 5
IBOC Mask Compliance
Oct 6, 2011 11:33 AM, By Greg Best, PE
A hybrid signal has challenges, but one method simplifies the process.

Table 2. FM IBOC transmission NRSC test report. Click to enlarge.
Table 2 shows an example of an NRSC emission mask spreadsheet with measured results. Where did those numbers come from? The top of the spreadsheet takes steps to ensure that your SA has its noise floor below where you plan the weakest signal measurement. The noise floor can be found by removing all signals to the SA, terminating the SA input with 50? load, setting the RF attenuation to zero, the reference level to approximately -40dBm, the RBW to 1kHz , the detector mode to RMS, and observing the noise floor in dBm of the SA. Now add a minimum of 80dB to it and that will equal the minimum RF sample level for the analog power reference. If the analog RF sample from the directional coupler is more than that number, then your SA is capable of making the measurement from a dynamic range point of view. To remember this, take the SA noise floor (1kHz RBW) + 80dB + measurement headroom (reasonable value is 10dB) and that is what the transmitter analog RF sample power should be. The same equation applies for combined or separate transmitters but remember to add the attenuators of the CHIMP.
Next measure the analog total power reference with an unmodulated carrier. This was found to be 0.0dBm in the example case. Then apply modulation to the analog transmitter (the digital transmitter is generating its spectrum with or without modulation applied). The recommended modulating signal for the analog transmitter is a 1kHz tone with the transmitter modulation at 75kHz deviation. If the transmitter is equipped with linearity correction, now is the time to engage and optimize it. Once that is done, remember to double check the analog power reference and the digital power ratio to make sure they are correct. The next step is to measure the power in the IBOC primary spectrum defined by the NRSC mask (e.g. +100 to +200kHz) at the frequency midpoint of the required mask level (i.e. +150kHz from Fo – the carrier frequency). The total measurement bandwidth is 100kHz (200-100), so that number is used to set up the channel power measurement (CP) mode of the SA. In the case below, the recorded power is -26dBm. That is the power in a 100kHz bandwidth matching the first line of NRSC mask as listed in Table 1. This measurement reflects the “plus” side of the center frequency so the measurement needs to be repeated for the “minus” side of center frequency. The next mask section starts at 200kHz and goes to 250kHz so the measurement frequency is the midpoint, or 225kHz, and the CP bandwidth will be set at (250-200), or 50kHz. In this case, the value measured was -65.2dBm. Because the mask limit line is sloped at the measurement frequency, the limit value must be calculated using Table 1 to determine the pass/fail threshold value. Again, the same measurement should be made for the “minus” side of Fo. The next section of the mask goes from 250kHz to 540kHz so the measurement point is the midpoint, or 395kHz + Fo, and the bandwidth is 290kHz so the SA CP mode is reconfigured for 290kHz, the value measured was -61.4dBm.
This process is repeated until all measurements have been made. As long as all measurements were at least 10dB above the SA noise floor, good engineering practice would indicate that the noise floor has not impacted the data and no correction for measurements near the noise floor is necessary. If the noise floor is 6dB or less compared to the measured level, good engineering practice would dictate that the noise floor power should be subtracted from the measured value. Remember that the only way to do this is to find the equivalent linear value power (not dBm) of the measured value and subtract the equivalent linear value noise floor power from it. Then convert the net power back to a logarithmic (dBm) value. If you find that the measured value is equal or lower than 3dB of the noise floor, just use the value that is equal to 3dB above the noise floor measurement. The reason for this is that it is uncertain which is being measured – signal or noise. Plus, whenever a very small number is subtracted from another very small number, the accuracy of the measurement is in jeopardy.
– continued on page 6
IBOC Mask Compliance
Oct 6, 2011 11:33 AM, By Greg Best, PE
A hybrid signal has challenges, but one method simplifies the process.
The NRSC emission mask limit values in Table 1 are all referenced to a 1kHz measurement bandwidth. But the measurements in the spreadsheet were made in different bandwidths (100kHz, 50kHz, 390kHz, etc.). To convert these measured values to a 1kHz bandwidth for comparison, it is necessary to scale the measured powers. To do that, simply add 10 log * (1kHz/measurement BW) in dB to each measured power to get the values in a 1kHz bandwidth. This scaling will reduce the amplitude values.
Once each measured value is corrected for measurement near the noise floor and for bandwidth, it is subtracted from the analog power. In this example, the power was 0dBm. So 0.0dBm – (-46dBm) yields a value of 46dB. This can be compared to the mask value of 40dB. Since the value is greater than the mask limit, the waveform passes the mask limit. To complete the rest of the spreadsheet for the entire IBOC channel measurement and comparison to the mask, the same process is followed.
Increased digital levels

Figure 9. Asymmetric FM hybrid spectrum. Click to enlarge.
The above analysis reflects the case for when the standard -20dBc IBOC digital power is used. Now that the FCC has authorized blanket power level increases to -14dBc, you might ask how that affects the mask value. The only mask change (refer to page 16, Table 6 of NRSC G202, at the NRSC website) is with respect to the area of spectrum containing the primary IBOC sidebands. Instead of being 40dB, the limit is decreased 1dB for every 1dB increase in operating power. For example, if the digital power is -17dB relative to the analog power, then the first limit of the mask would be 37dB instead of 40dB. Although the FCC has only authorized experimental FM IBOC stations for operation with asymmetric sidebands, NRSC G202 also addresses how to make these measurements. The purpose of using asymmetrical sidebands is to maximize digital reception while not causing interference to a lower or upper adjacent channel. Figure 9 shows an example of asymmetric sideband operation on an SA.
If you operate a station with asymmetric sidebands, the process is essentially the same with a small twist. The twist is to first determine the total digital power relative to the analog power. NRSC G202 provides a table for doing this for various degrees of sideband asymmetry. Once that detail is known, then the emission mask is measured as if symmetric sidebands of the total digital power were used. For example, assuming that only MP1 mode is used, and one sideband is at -20dB and the other sideband is at -17dB, Table 2 identifies the total digital power relative to the analog carrier as -15.2dB. From there, the emission mask compliance measurements are conducted as if the total digital power was -15.2dB relative to the analog power.
This is quite a bit of information to absorb in one reading, but keeping the key points in spectrum analyzer use and focusing on the process steps will help guide you through these measurements on your own. Hopefully this information will allow you to approach measurement of your hybrid FM IBOC station for emission mask compliance with some confidence. Keep resources at your disposal so that accurate results can be achieved, and digital and analog stations will continue to operate without interference.
Best is president of Greg Best Consulting, Inc., Kansas City.
October 2011
Streaming to mobile devices, a tour of the new CJWV, insight into IBOC mask compliance, the Radio magazine annual salary survey, Field Reports on the Blue Mics Yeti Pro and Harris Intraplex HD Link and more….