Here you will find the Figures and Tables, as well as additional Appendices mentioned in “NAB Labs All-Digital AM Test Project, Part II” published in the June 15, 2016 issue of Radio World Engineering Extra.
Table 1: Test receivers
Table 2: AM test receiver input impedances at 890 kHz
Table 3: AM test receiver threshold of digital reception
Table 4: Phase 1 test matrix. Shaded test numbers indicate test conditions for which audio recordings were made.
Table 5: Phase 2 test matrix. Shaded test numbers indicate test conditions for which audio recordings were made.
Table 6: Organization of audio tracks for six-minute audio source files.
Fig. 1: Test bed RF signal flow diagram
Fig. 2: Test bed audio signal flow diagram.
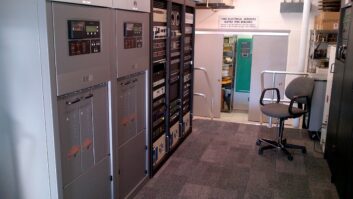
Fig. 3: Equipment rack layout — RF rack
Fig. 4: Equipment rack layout — audio rack
Fig. 5: Test receivers
Fig. 6: Automotive receiver RF signal interface
Fig. 7: Insignia receiver RF signal interface
Fig. 8: Spectrum analyzer plot showing RF output of test bed with all receivers connected and operating
Fig. 9: Screen cage test setup
Fig. 10: All-digital signal 30 kHz channel power
Fig. 11: Unmodulated analog signal 30 kHz channel power
Fig. 12: RF spectral occupancy with analog pulsed USASI modulation
Fig. 13: RF spectral occupancy with all-digital AM modulation
Fig. 14: RF spectral occupancy with all-digital AM modulation showing extended sideband noise floor
Fig. 15: Lissajous pattern corresponding to 0° phase-locked carriers
Fig. 16: Amplitude vs. time plot showing 0° phase lock
Fig. 17: Amplitude vs. time plot showing 90° phase lock
Fig. 18: Lissajous pattern corresponding to 180° phase-locked carriers
Fig. 19: Amplitude vs. time plot showing 180° phase lock
Fig. 20: Oscilloscope plot showing setting of 1 Hz frequency offset
Fig. 21: Comparison of SNR performance for receiver #2 without (Phase 1) and with (Phase 2) simulated environmental RF noise
Fig. 22: Phase 2 test results for receiver #2
Fig. 23: Phase 2 test results for receiver #1
Fig. 24: Phase 2 test results for receiver #3
Fig. 25: Phase 2 test results for receiver #4
Fig. 26: Phase 2 test results for receiver #5
Fig. 27: Block diagram illustrating the use of the Audio Precision test set to simultaneously generate both the desired (left channel) and undesired (right channel) audio signals


