The author is president of Burk Technology.
If you have transmitter sites to care for, you know each emergency means an engineer on the road and possibly lost airtime.
Remote control systems have traditionally allowed transmitter observations to be made remotely, but modern systems are capable of much more. Here are some tips to improve routine maintenance and reduce emergency calls using the versatility of a modern remote control.
Virtual channels add meaning.
Virtual channels can take data from other channels and synthesize new data mathematically. Each virtual channel uses an equation to process this data in real time. These channels can be logged and used for alarms and to trigger macros and notifications just as regular channels. Here are a few classic examples, but you can probably think of more:
It’s getting hot!
Knowing the heat rise in your transmitter is important. Two temperature probes can give you a way to measure the rise in temperature in your transmitter. Simply use a virtual channel to subtract the input temperature (or even the room temperature) from the exhaust plenum temperature. Stack probes make it easy to pick up the temperature in a closed plenum. The virtual equation is simply M1 – M2.
Is your efficiency sufficient?
A sudden drop in transmitter efficiency means trouble. Look at the other readings to determine a possible cause. If it suddenly gets better, you likely have a faulty meter sample.
The formula for efficiency we are all familiar with is Power Out divided by Power In. The input power is final volts times current, so efficiency simplifies to P Out / E / I. (If this simplification doesn’t make sense, try it on paper.)
Assuming the first three metering channels, Fig. 1 shows the equation.
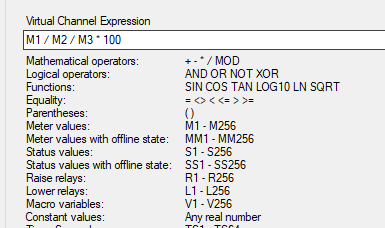
Set this virtual channel to alarm if too high or too low, and make sure you add it to the log.
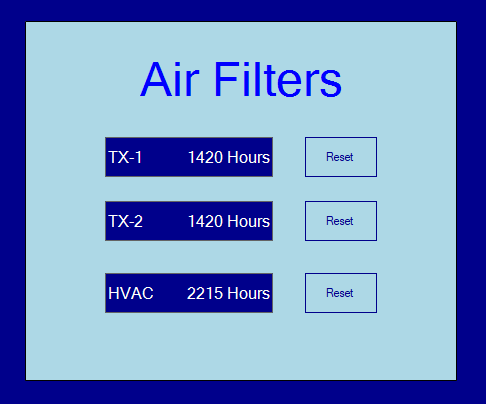
It’s been a while.
Just how long have those air filters been in there? Set up a virtual channel for each such item and assign it to a timer. Elapsed hours can be accumulated and can trigger a warning if overdue.
As shown in Fig. 2, a command button for each can be used to reset the timers when the maintenance is performed.
Straight as an arrow
Ever have a sample that isn’t linear? Here is a fix:
Measure across the needed range and record actual and indicated values. You’ll need at least three points, but more is better.
Now put the actual and measured values in a graph in excel as shown in Fig. 3. Try different degrees of polynomials and pick the lowest order that gives you a good R squared value.
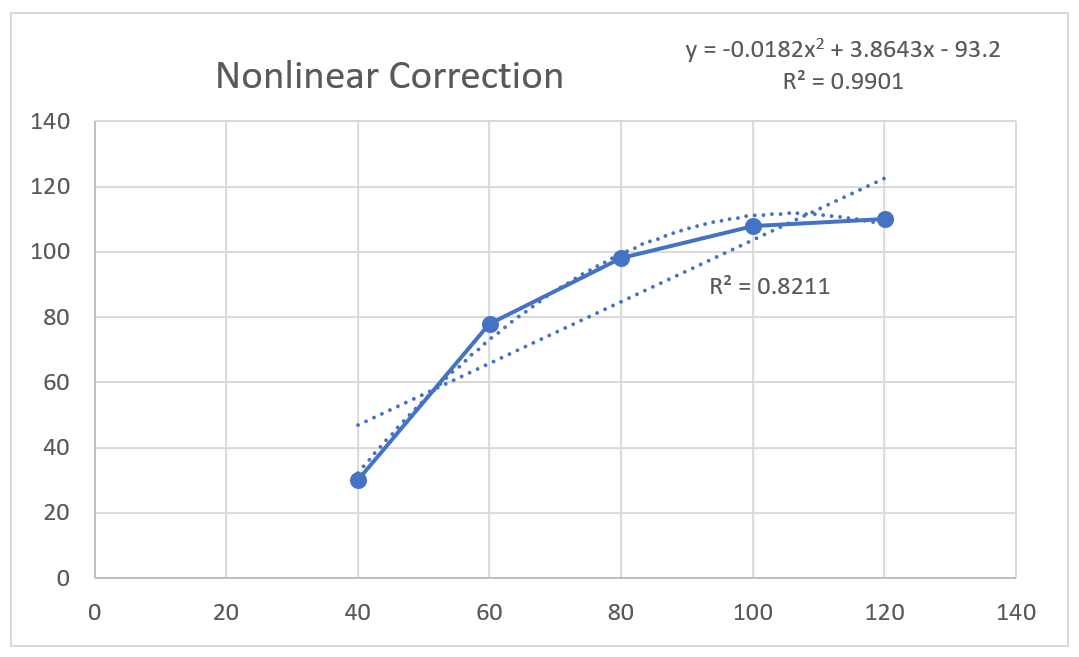
In this case a second order polynomial works well. The equation for Channel M1 becomes:
.0182 * M1 * M1 + 3.864 * M1 – 93.2.
Voila: a transfer function that is linear.
APIs add data.
There are many data sources that are not physically connected at the site but are available through an Application Programming Interface (API).
The obvious example is a source of free weather information such as weather.com. This can provide a virtual weather station that represents the conditions in a radius of about 1,500 meters of your site. Good enough to know when to automatically turn on the deicers. Add 0.35 degrees per 100 feet of antenna height. It’s 7 degrees colder at 2,000 feet!
Burk has an app note available that explains how to use APIs.
Alarm on low VSWR.
That’s not a typo! Most engineers alarm on high VSWR, as well you should, but there is also a reason to alarm if the meter sits on the left peg. A VSWR indication of near-perfect may look comforting, but it is likely a faulty sample. To assure VSWR protection, alarm if it is too good to be true.
Don’t miss a beat.
If you are lucky enough to have an auxiliary transmitter, you should already be switching to it automatically when the main transmitter fails.
It is important to test the aux regularly, but you don’t need to get out of bed to do it. Schedule a flowchart or macro to run the text on a regular basis.
Test on-air with the same sequence as your normal recovery. You will be testing the complete backup chain so recovery in a real failure will be smooth. Let your routine tell you about the test in the morning.
Mr. Pearson and his coefficient
Most of us diligently keep transmitter logs, but what do you do with the data? There is a lot of interesting information in there if you dump the log data into Excel and start digging.
Ever wonder if AC line voltage affects power out? Does the STL signal fade on warm days? How does tube age affect efficiency? Those are the kinds of questions that you can answer with a stack of logs and the Pearson correlation coefficient.
In Excel, fill two columns with the values to test and put “PEARSON(Array1,Array2)” in another cell as shown in Fig. 4.
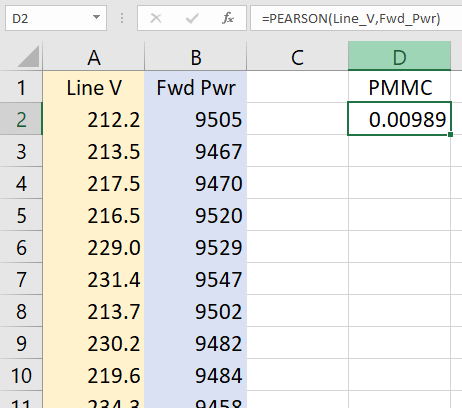
The answer will be between –1 and +1, with zero indicating no correlation and one representing a perfect correlation.
Continuous Improvement
If your system has been in place for a few years, there are improvements that you can make to avoid future down time. Call your equipment suppliers or check the web for the latest updates.