The author is technical publications manager and a senior technical writer at Audio Precision in Beaverton, Ore.
When reduced to its basics, the process of audio test and measurement is concerned with a small number of performance benchmarks. At my company, we call these “the Big Six,” and they are as follows:
- Level
- Frequency Response
- THD+N (Total Harmonic Distortion plus Noise)
- Phase
- Crosstalk
- Signal-to-Noise Ratio (SNR)
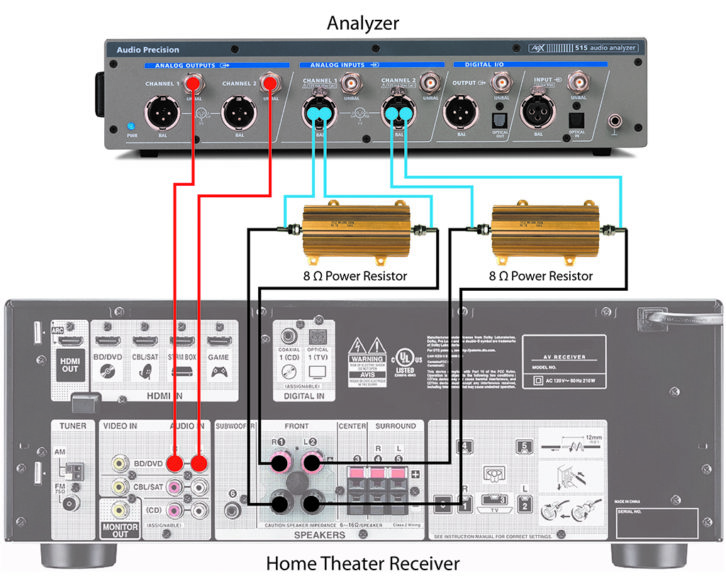
Fig. 1 shows a typical test setup for the Big Six audio measurements.
LEVEL
Any Device Under Test (or DUT, as often referenced in the world of test and measurement) may have a number of level measurements that are of interest. You must choose which level you are seeking. Target levels include:
- an input level that produces a given output level, such as 1 volt, or 1 watt, or unity gain (see below for a discussion of DUT gain);
- an input level that produces a certain output distortion, such as 1% THD+N;
- a level that provides good noise performance with comfortable headroom, often called the operating level;
- an input or output level specified in a testing document.
Any of these levels may be used as a reference level on which we can base further measurements. Frequency response measurements, for example, are expressed relative to the level of a mid-band frequency; THD+N measurements are made at specified levels, which should be reported in the results.
The ratio of a DUT’s output voltage level to its input voltage level is the voltage gain of the DUT. For example, in a DUT with a gain of 2, an applied input of 2 volts will produce an output of 4 volts. A gain of 1, where the output voltage equals the input voltage, is called unity gain. Some DUTs offer no gain adjustments, and are said to have fixed gain. The gain may be fixed at unity, or at some other value.
A DUT with a volume control or other setting that affects gain is a variable gain device. When setting and measuring level, it is essential to consider whether or not the DUT gain is variable (not only volume controls, but tone controls and other settings can change gain), and, if it is, how to set the DUT controls for the desired test results.
FREQUENCY RESPONSE
A frequency response measurement reports the output levels of a DUT when stimulated with different frequencies of known level. The simplest of all frequency response measurements consists of only two or three tones, the first near the middle of a DUT’s usable frequency range, and followed by a tone near the higher extreme of the range and sometimes a tone near the lower extreme. Assuming the tones are all generated at the same level, the DUT’s output levels describe its response to these different frequencies.
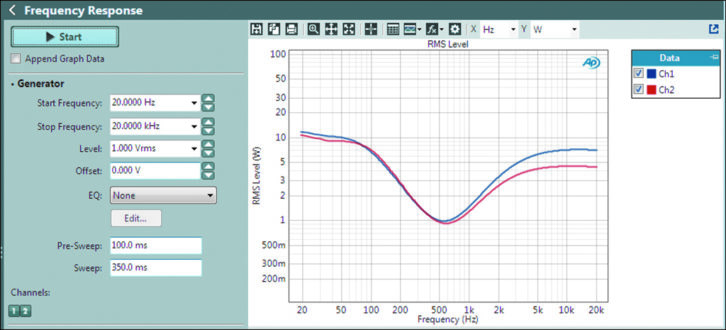
Full-range frequency response measurements can be made by a number of different methods, the classic being a sweep of a sine wave from the lowest frequency in the range to the highest, with the results plotted on a graph. A “flat” response describes the shape of a graph where the DUT responds equally at all frequencies, producing a trace with a slope of 0 and with minimal variations. Fig. 2 shows a typical result.
THD+N
THD+N stands for Total Harmonic Distortion plus Noise. Harmonic distortion is the unwanted addition of new tones to the audio signal. These tones are harmonically related tones to the original signal: when the signal is one sine wave of frequency f1, harmonic tones are f2, f3 and so on, at integral multiples of the original tone. Total harmonic distortion is the sum of all of the harmonics measured in the DUT’s bandwidth.
Why THD+N? Why not just measure THD (the distortion) and N (the noise) individually? Well, in the pre-FFT days of audio measurement, it was difficult to measure the THD by itself, without the noise, but it was relatively simple to measure the THD and the N together. So the accepted techniques handed down from years past specify THD+N, because that’s what was practical. In addition, THD+N is a convenient and telling single-number mark of performance, widely understood and accepted.
The measured THD+N of a device will vary with the measurement bandwidth. You will almost always want to restrict the measurement bandwidth using high-pass and low-pass filters, and you must include the bandwidth used when you state the result. THD+N is typically measured and reported in a 20 Hz–20 kHz bandwidth.
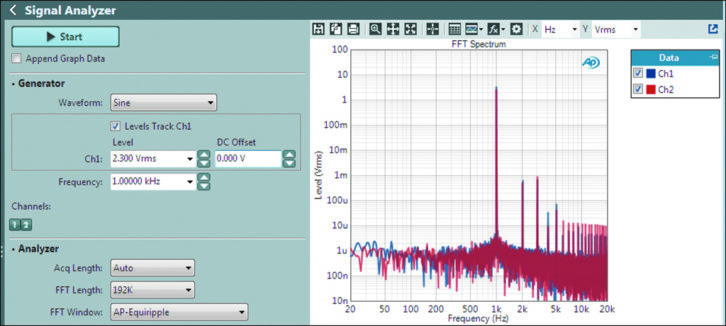
The measured THD+N of a device will also vary with level and the frequency of the applied signal. Audio THD+N is typically measured and reported at a mid-range frequency (1 kHz or so) at either the device’s nominal operating level or at its maximum output level (MOL). Fig. 3 shows a typical THD+N measurement result at MOL.
PHASE
In audio engineering, phase measurements are used to describe the positive or negative time offset in a cycle of a periodic waveform (such as a sine wave), measured from a reference waveform. The reference is usually the same signal at a different point in the system, or a related signal in a different channel in the system. This choice of references defines the two most common phase measurements: device input/output phase, and interchannel phase.
Phase shift varies with frequency, and it is not uncommon to make phase measurements at several frequencies or to plot the phase response of a frequency sweep. Phase is expressed in degrees.
CROSSTALK
In audio systems of more than one channel, it is undesirable for the signal in one channel to appear at a reduced level in the output of another channel. This signal leakage across channels is called crosstalk, and in practical devices it is very difficult to eliminate. It’s expressed as the ratio of the undesired signal in the unstimulated channel to the signal in the stimulated channel.
Crosstalk is largely the result of capacitive coupling between channel conductors in the device, and usually exhibits a rising characteristic with frequency. It’s often expressed in the form of a single-number result; however, a crosstalk versus frequency sweep will show how a DUT performs across its operating bandwidth.
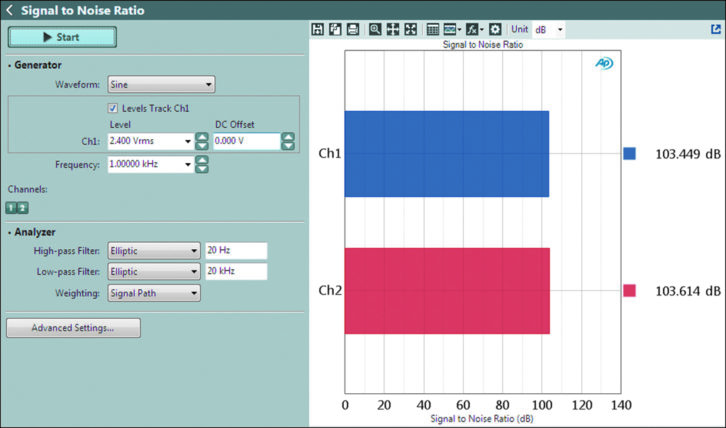
SIGNAL-TO-NOISE RATIO
How much noise is too much? That depends on how loud your signal is. Signal-to-noise ratio (or SNR) is a measure of this difference, providing (like THD+N) a single-number mark of device performance. The signal is usually set to the nominal operating level or to the maximum operating level (MOL) of the DUT. When SNR is made using the MOL, the result can also be called the dynamic range, since it describes the two extremes of level possible in the DUT. (Dynamic range in digital devices has a somewhat different meaning). SNR is usually stated in decibels, often shown as negative. Fig. 4 shows a typical SNR measurement result.
Using traditional methods, SNR requires two measurements and a bit of arithmetic. First you measure the signal level, then turn off the generator (and often, terminate the DUT inputs in a low impedance as well, to fully reduce the noise in the device). Then the noise level (often called the noise floor) is measured, using filters to restrict the measurement bandwidth. The ratio between the two is the SNR.
David Mathew has worked as both a mixing engineer and a technical engineer in the recording and filmmaking industries. He was awarded an Emmy for his sound work in 1988.