One of the great things about having equipment with network capability is the ease with which you can get to that equipment and configure it, and the dramatic increase in the amount of diagnostic and performance data you can receive from it.
Of course, with so much data at your fingertips, the hard part for broadcast engineers is trying to find a way to filter that information into something that is concise and meaningful and that allows them see their operation at a glance.
The best way to do that is by using the Simple Network Management Protocol, or SNMP.
For the past year or so, I’ve been trying to wrap my gray matter around SNMP. “Real” IT folks have been using it for decades to keep track of network speeds, operating systems, hard drive capacities and a host of other metrics around their data centers.
It may have just been me, but I wasn’t finding real how-to-do-it kind of articles. It seemed most writers just wanted to keep the secret to themselves and dazzle you with sharp terminology.
After several failed attempts, I found a solution that made sense to me. It’s called Paessler PRTG network monitoring, and it allows me to monitor all of the devices I have set up (up to 100 for free).
It also gives me a mobile device app that provides notifications when something is not behaving correctly on our network.
In preparation
Before we set up any solution, let’s talk about how SNMP works.
Device manufacturers that want their equipment to talk on a network develop a Management Information Base (MIB) file. The file is a reference database of structured definitions and Object Identifiers (OIDs) that numerically represent any kind of data possibility that you may want to pull from the equipment.
SNMP allows polling of equipment, but also has traps designed into the protocol as well so that certain datum can initiate messages back to the monitoring software (i.e. a threshold has been surpassed).
I won’t address traps here, but it is important to know that they exist and can be used as part of your solution as well.
So not only will we need the monitoring software, but we need some software to help us sift through all the OIDs available and only use those that we really want information about.
In preparation, we’ll need to download the necessary software. Both the Paessler software for network monitoring and the Ireasoning MIB Browser for parsing MIB files are freely available.
The other downloads that will be necessary at some point are the MIB files for your equipment. You can generally download the files from the manufacturer, but pay attention to the hardware models, as an MIB may vary from one device to another.
The Paessler software requires a Windows machine and sets up the network monitoring on that machine. It almost goes without saying that the machine should be a part of the network that you are trying to monitor.
Note that network monitoring isn’t a resource intense activity on simpler networks, so an older machine will do fine for this purpose.
Setting up
PRTG configures a web server as well so that you have access to the information gathered locally on the network. But to harness its real power, you’ll want to forward a network port (any port, like 23333 as an example) on your router or firewall to that local machine’s web server (secure https-port 443) so that you can have access to that data from the outside world via another machine or the mobile app.
Installing PRTG is pretty straightforward. After choosing a strong password, you can immediately begin putting in device information.
Even without any knowledge of MIBs and OIDs, you can begin to configure PRTG to send network pings to devices so you know that they are online on your network.
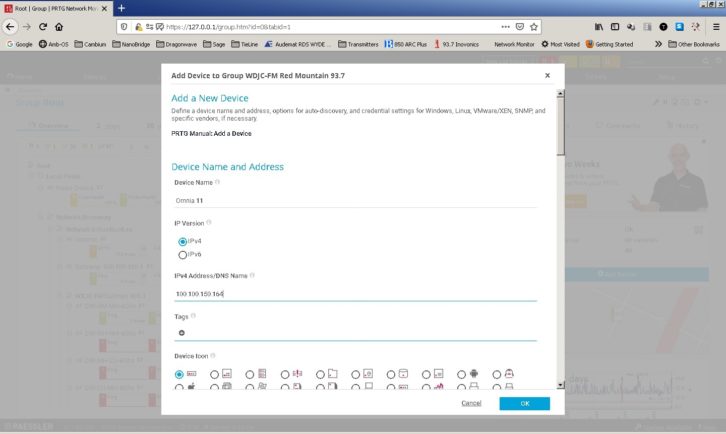
Simply choose to add a device, fill in the appropriate name and IP information, and choose an icon that makes sense to you. See Fig. 1. Once that is done, you’ll see it show up in your “Network Infrastructure” list under the name you gave it.
Next, choose to add a “sensor,” like a network ping. It might seem daunting, but once you add a device you can also choose “auto discovery” for the device.
Of course, it will find a number of things that you may not want to monitor, and you may quickly push the 100-sensor limit of the free software. Any sensors in the auto discovery that you don’t find useful can be removed with a right click of the mouse and choosing to delete that monitor information.
I have found it useful in PRTG to go ahead and create groups by location and then to add devices inside of that group. As a for-instance, we have four tower sites on our network, so I have identified each in a group and then added the related transmitter and devices such as STL IP radios and codecs inside of that group. In this way, my notifications tell me immediately which site is having an issue.
The auto discovery isn’t going to find all of the information that a broadcast engineer really wants to know, such as a transmitter’s forward and reflected power indications, STL path RSL voltage levels or any of a host of other polled information. Before we really get started adding those parameters, you’ll need to jot down some SNMP information that is available for each monitored device.
SNMP requires network ports 161 and 162 to be open (they generally are), a “Read Community” string and a “Write Community” string (usually “public” or “community”), and you’ll need to know the SNMP version the device is set up to use (normally V1, V2c or V3, each increasing in security level). We’ll need all of this information in the Ireasoning MIB browser.
Once the MIB browser is installed, go into the “File” menu and import the MIB files that you’ve downloaded from each vendor. See Fig. 2. You’ll see a directory structure populate in the window that contains the data options available for the equipment that you have.
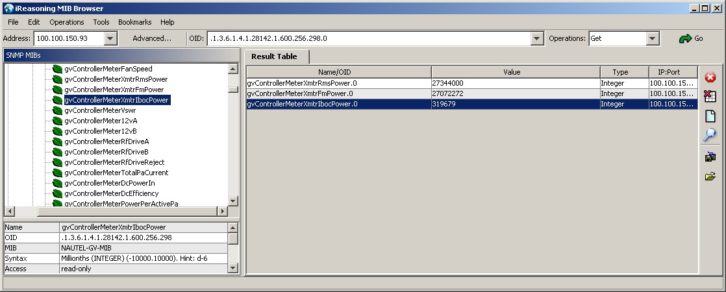
With that done, we’ll enter the IP address of the device we want to get data from, and then click the “advanced” button to make sure our read and write community strings are accurate and the SNMP version is correct.
Next, we’ll browse the MIB folder structure to find the OID (data) that we need.
Now that we’ve found the OID we’re looking for, we simply click the “Go” button on the right. The browser will query the device for the data and display it in the window on the right. The most important part of that whole operation is getting the OID number that you need to use in PRTG to poll that data automatically.
If you are feeling really brave and want to see just how much information is really available to you via SNMP from that device, click the down arrow in front of the “Go” button and choose “walk” and then click “Go.” Then go refresh your coffee.
Obviously you won’t need every piece of data that you’ll see from that operation, but isn’t it nice to know that you could have it if you did?
In Fig. 2, you can see that I’ve imported our Nautel GV40 MIB file and have found the OID numbers for the transmitter’s RMS forward power, its FM power and the IBOC power.
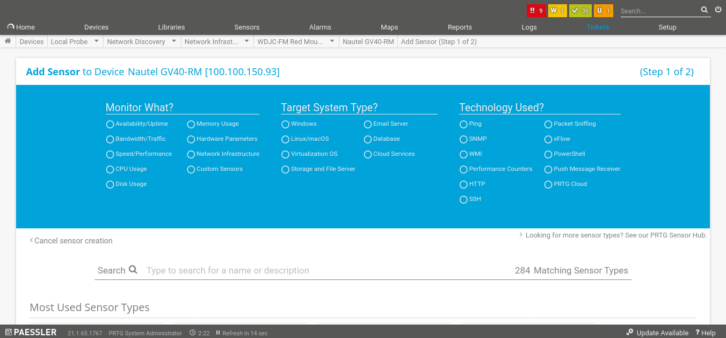
Once we have the actual OID number for each piece of data, we can hop back into PRTG and add a sensor to the equipment we have already added. When we choose to “Add Sensor,” we’re taken to a page where we’re asked what type of sensor. For our purposes, our answer will almost always be to click SNMP and then choose the SNMP Custom. See Fig. 3.
From there, similar to adding a device, we can name the sensor and put the OID number, the value, and unit. As you can see in the MIB browser image in Fig. 2, the value you get may need to multiplied or divided the value by a multiple of 10 for it to be correct, which you’re given the option to do in this sensor screen.
Once the sensor is created, it will take a minute or two to get its value, and you’ll be able to see if everything looks satisfactory. If you are anything like me, you may need to go back and edit several times to get the value to display the way you want it to.
Going forward, it is simply a matter of repeating this procedure until you have all the equipment you want to monitor in place and grouped together the way you want them.
Is it worth the effort?
Obviously, you can devote a whole lot of time to this, and you might begin to question if it is worth the effort.
There are two powerful aspects to installing something like this that you might consider. The first is that if you choose to port forward through your firewall to the web page that PRTG establishes, you can have web access to the page from anywhere and can evaluate the data in that way or via your cellphone and the PRTG app available in either Android or IOS store (including Apple watch) that allow you to get notifications when any sensor that you have setup doesn’t respond. See Fig. 4 for an example.
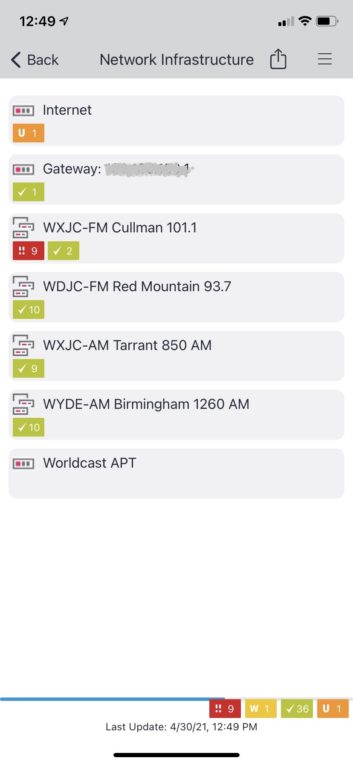
At a glance, can see a load of valuable information about network speed via pings, where the failure point is in a STL path via receive dBm levels, and your transmitter’s forward and reflected power indications. During an emergency, you’ll immediately be able to direct your attention (and vehicle) to the location of the cause of the problem.
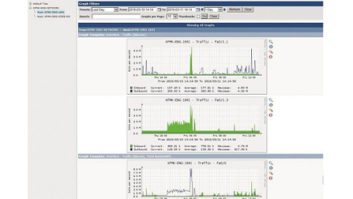
The other power comes through the graphical histories that PRTG can provide for each device. You can see historical values for each sensor. If you want to know exactly when you went off the air and when things were restored, you can check any of the histories to find out.
You’ll also have notifications and emails that you can reference. PRTG really helps to aggregate all of this data so that you can manage the increasing amount of detail that is necessary to keep stations running at their best.
So far, here in our market, we’re only using about 47 sensors to monitor four of our five transmitter sites and their associated IP radio STL paths (one site doesn’t have network data access). I plan to add our audio codecs for each location into the system as well, which will put us at around 65 sensors.
Certainly, there will be users who need to manage bigger systems, and 100 sensors might have them pushing the limit of the sites they could manage. There are also a number of cases where an engineer might never use all of the data options that the free version of PRTG offers them.
Whatever size operation you find yourself managing, the best time to begin harnessing the power of using SNMP network accessible devices is today, and you can get into it on no budget at all using PRTG network monitoring and the Ireasoning MIB browser.
The author is engineer for Crawford Broadcasting’s Birmingham region.
Got an idea for a great technical story with tips or best practices? Email Cris Alexander at mailto:[email protected]