Every two years, the Federal Communications Commission now is required to publish a Communications Marketplace Report that assesses the state of competition across the broader communications marketplace in the United States. The FCC recently released the second such report.
Broadcasting is one of the many market segments included. The report makes for interesting reading and I recommend you check it out. The discussion of the audio market, including radio, appears on pages 142–156.
Here I thought I’d share six charts from the report that capture various aspects of the FCC’s discussion about trends in U.S. radio.
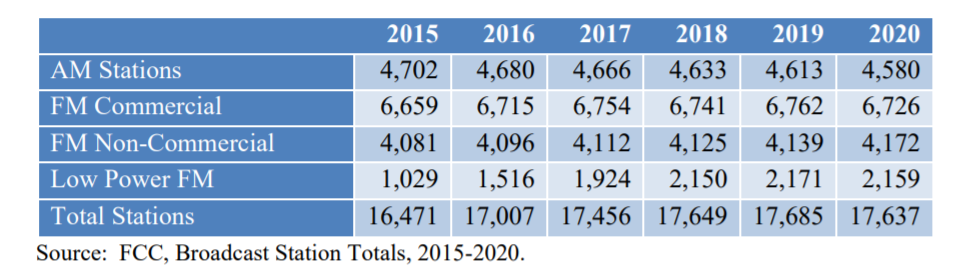
Station count
The FCC noted that the number of AM and FM stations licensed in the United States, below, has remained steady in recent years, while the number of LPFM stations has increased. It reminded readers that new stations are possible only through new allocations and award of licenses, either via an auction in the case of commercial stations, or a comparative system for non-commercial stations. (Also see my recent related story that compares the 2020 numbers to the year 2000.)
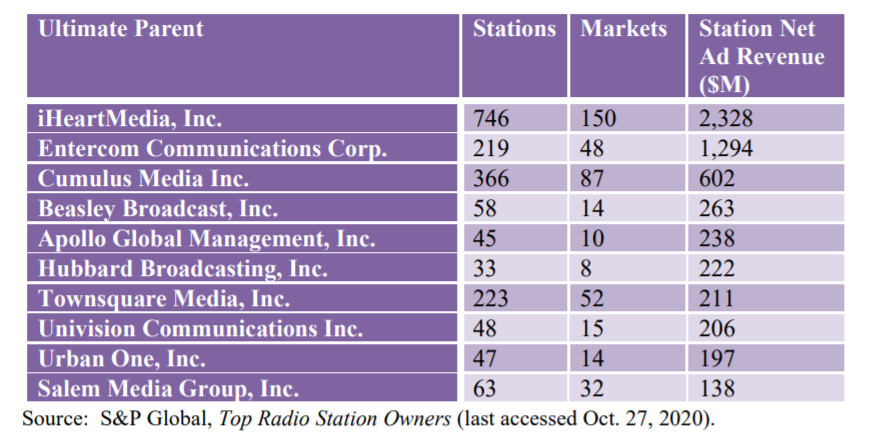
Top 10 radio station owners
To secure the highest ad rates and to compete for advertising market share, the FCC reminds us, stations strive to gain the largest audience of listeners possible to maximize the price for ad time sold. Below it ranks the top 10 largest radio station owners, by revenue.
“These owners control stations that are not confined to particular geographic regions; they are spread out across various geographical markets.” (And here’s a link to what the list looked like in 2006, though from a different research source.)
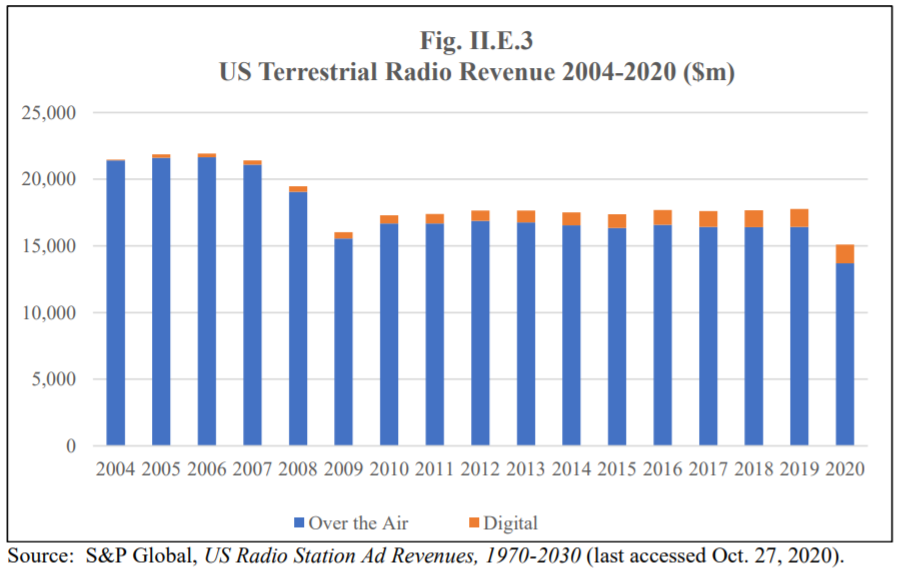
U.S. terrestrial radio revenue
The FCC observed that radio ad revenue had been virtually flat between 2010 and 2019 but that 2020 was expected to see a drop of around 15% due to the pandemic. “While these numbers are preliminary, the predicted decline in advertising revenue is substantial.”
The chart below also indicates that revenue never fully recovered from the recession following the 2008 financial crisis.
“In a recent report, S&P Global predicts that advertising revenue for terrestrial radio stations will face a tougher road to recovery from the pandemic-induced recession compared to broadcast television stations.”
The chart also captures the growth in revenue from online radio compared to OTA.
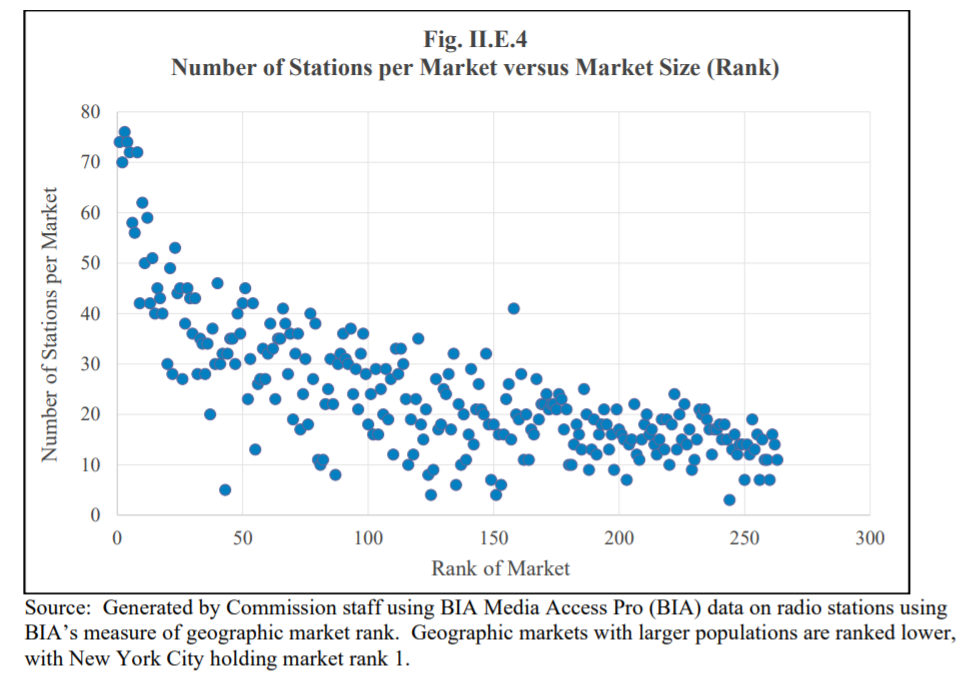
Stations by market size
The next image is a scatterplot of the number of stations within a market against the market size, measured by rank.
“The number of radio stations available decreases as the market size decreases, suggesting more choice in markets with higher populations. Not shown in the table, however, are additional choices that listeners have that include satellite and online radio …”
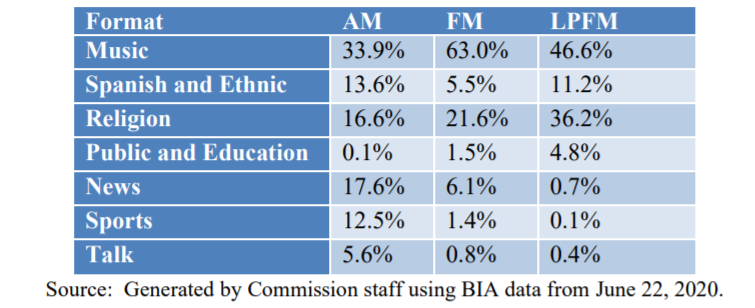
Programming formats for terrestrial radio
The commission said interference issues may have contributed to AM stations favoring talk formats relative to music; 63% of FMs identify with a music format, while only 34% of AM stations do. AMs favor Spanish and ethnic, news, sports, and talk. The percentages of stations that air religion are similar for AM and FM stations. Public and education format stations predominantly use FM. Nearly half of LPFMs are music; about 36% provide religious community programming.
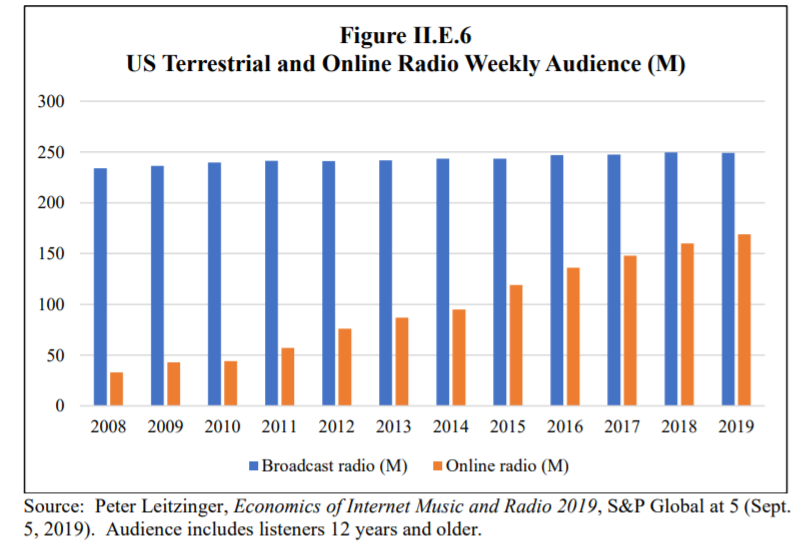
US terrestrial and online radio weekly audience
“While broadcast terrestrial radio remains dominant in some respects … the gap in usage between broadcast terrestrial and online audio has declined over time.”
Over the past decade, the number of listeners to terrestrial radio grew annually around 0.55% on average, while annual growth in online radio was 29%. (Though part of online growth was due to listeners accessing AM/FM broadcasts online, the FCC said the figure below “illustrates the dynamic nature of audio as listeners continue to access online radio across a diverse range of devices.”)