To engineers in the audio media and broadcasting fields, few subjects are more personal, and partisan, than the transmission level and loudness of audio content. If loudness was no issue we might see more consistency across various media — but I’m getting ahead of matters.
In the Jan. 1 issue of Radio World, our article “NPR Labs Eyes Streaming Technology” discussed a study to find the best codec and optimum bit rate for public radio streaming, a study commissioned by NPR’s Digital Media division.
That selection process proceeded smoothly from start to finish, but early in the study it became apparent that another issue was potentially as important to public radio listeners of Internet streams as digital quality: consistency of loudness from stream-to-stream, and sometimes from program-to-program within a stream.
This issue led NPR Labs on an extensive study of audio measurement — one that continues — and that we share here. While the study was conducted for public radio, the premise and conclusions may be helpful to commercial broadcasters that stream audio as well.
VARIANCES
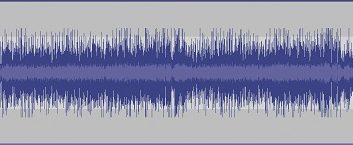
The first indication that audio level needed attention came from a study of 49 streams carrying the same program from NPR (“Weekend Edition Saturday”) in February of 2012. Fig. 1 shows a waveform envelope for the streams as a consecutive sequence of 45-second audio clips. Only speech segments were used, although the speakers may vary. It was evident that signal peaks varied widely from stream to stream: the difference between the loudest and softest streams was more than 22 dB in peak signal level.

Differences in loudness were roughly in line with the signal level. Allowing for slight differences with different speakers in the program, we expected to only see differences of a few dB across the group. This spread was likely to annoy listeners as they changed streams.
Public radio is by no means the only source of difficulty: listeners experience similar variations on commercial radio streams, and worst of all, it appears, on freelance audio streamers. Fig. 2 shows a sequence of 46 randomly-selected commercial radio music streams from a major stream aggregator (who offers these streams on-demand through custom player software). In this chart, the loudness has been indicated on the blue line and the signal peaks are shown in yellow, which digital full-scale at 0 dB. The sharp drops show the audio gaps between station samples.

The differences are less, amounting to little more than 10 dB at the most, but most of these streams are highly compressed and limited, as shown by the flatness of the signal peaks across each of the samples. This compression makes differences in loudness of a few dB quite noticeable. The stream aggregator should be commended for moderating the loudness levels around –23 LUFS (a measurement of loudness discussed below), although the compression and limiting of the station audio is wasting a good deal of peak headroom.
Not all stream providers have not seen fit to moderate their transmission level. Some audio streams have been measured by the author as high as –5 LUFS, a condition that would probably make any listener lunge for the volume control! This high loudness is the result of heavy dynamic compression and peak clipping. These streams are frequently freelance audio services, rather than broadcast stations, but the point is that the “loudness war” does exist on some Internet audio streams.
LOUDNESS
Fortunately, a great deal of work was already done on loudness measurement by some dedicated engineers on working groups at the Radiocommunications Sector of the International Telecommunications Union and the European Broadcasting Union. Their research over many years led to the development of an algorithm to measure program loudness similarly to human hearing, currently defined by Broadcast Systems recommendation BS.1770‑3.
The ITU loudness algorithm first performs frequency weighting for each channel, rolling off below 100 Hz and providing a uniform boost to frequencies above 2 kHz of about 3.5 dB. The total means-square amplitudes are calculated, summed and logarithmically converted to a decibel scale. This provides a real-time indicator with the instantaneous program loudness in Loudness Units (“LU”), where a change of 1 LU is 1 dB.
A relative-threshold gate is added to pause the measurement when the signal drops below a certain threshold. This prevents silence or background sounds from biasing a long-term integrated loudness value. This algorithm supplied the audio stream loudness measurements in Fig. 2. The ITU algorithm also defined the method of measuring the reconstructed signal peaks that accompany the loudness graphs.

The ITU loudness meter display is often combined with a peak meter, as both are significant indicators. An example is the K-Meter, a program for Windows and Unix computers, as shown in Fig. 3: ITU loudness is indicated by the solid green bar while the momentary signal peak is shown by a single red segment. Another example is Orban’s Loudness Meter, which provides logging of measurements. Many of the measurements herein were recorded with this meter software.
Watching program audio with an ITU loudness meter and peak meter, one of the first things one notices is that loudness and signal peaks do not correlate well. Some material will indicate lower margins than others, for example, popular music that has been peak-limited, compared to live speech.
Peak indicators are now the most common indicator for monitoring and measuring program level, in production and transmission. Their importance is understandable, given the absolute headroom limit of digital audio.
However, the human ear does not evaluate signal peaks; we sense loudness in terms of a complex psychoacoustic process of audio frequency and duration, which the ITU loudness meter strives to indicate. Consequently, the inaccuracy of peak meters as a loudness indicator is a reason that Internet streams have such irregular loudness. If one wants to make audio reasonably consistent from stream to stream, and please listeners as they change streams, the ITU loudness meter is arguably the best tool for the job.
ANNOYANCE
NPR Labs’ research found that listeners do respond — unfavorably — to changes in loudness. We were interested to learn what consumers thought of within-stream changes in loudness, as part of the major consumer study on codec selection. The codec selection study was covered in our first article.Listeners used a computer program to register their reaction to changes to various shifts in program volume (measured in LUFS), indicating when the changes occurred if they would do nothing, reach for a volume control (to turn it up or down), or, if repeated they would “turn off the radio.”
Fig. 4 shows their responses: Beyond a 4 dB shift, annoyance rapidly sets in, and listeners would quickly change from “doing nothing” to “turn off.” While this test was an in-stream measure of listener behavior, it suggests how listeners may feel if, for example, they are driving the car and change streams that are much louder or softer than others.

(Another test, designed to determine if natural changes in loudness within a program would affect listeners, found relatively high acceptance. This suggests that listeners accept natural changes that result from dynamic range.)
With the help of loudness meters, especially ones that can display a measurement log over time, consistency in loudness can be easily achieved.
Fig. 5 illustrates the process, called “loudness normalization.” In this chart, the stream at the left is logged for a few minutes, producing the solid blue line for short-term loudness and the solid red line for signal peaks. It has a long-term (average) loudness, indicated by the dotted blue line, of approximately –14 LUFS at the end of the sample period.

Measurements should be taken for longer periods when the program has greater dynamic range. The other audio stream is logged for a similar time interval and has a long-term loudness of about –27 LUFS. A listener switching from the first to the second stream would hear a drop in loudness of approximately 13 dB.
Based on extensive study of programs from a range of broadcast material, the EBU adopted a target loudness of –23 LUFS for production and transmission. (The EBU R128 standard and the ATSC A85 standard for U.S. digital television share similar values and techniques for loudness normalization.) This loudness value permits most programs with greater dynamic range and signal peaks to fit safely under the digital full-scale limit.
Normalization of the two audio streams, then, simply lowers the encoding gain of stream number one by 9 dB (from –14 LUFS to –23 LUFS), and raises the gain of stream number two by 3 dB (from –27 LUFS to –23 LUFS). Voilà! The two streams now have a similar loudness.
CONSISTENCY
Using loudness metering at the production stage, and calibrated gain levels along the program chain, ensures that programs can be produced with known, consistent loudness, without relying on as much audio processing at the transmission point to correct variations in loudness. (For the same reason that signal peaks do not correspond well to our sense of loudness, peak-responding processing does not necessarily produce natural, consistent loudness in program audio.)
It is apparent that stream number one would have signal peaks that are well below full scale, probably because they are being limited by audio processing before transmission. (It’s been reported that some engineers have taken advantage of this headroom, by reducing the peak limiting, resulting in a more open and natural sound, I would submit.)
However, normalization in no way dictates how one should process their audio — some engineers or programmers prize a particular “sound” resulting from processing. this technique just encourages agreement between the media producers, which benefits listeners. It is nothing more than observance of a common standard for transmission loudness — there is nothing to prevent a rogue operator from pursuing a loudness war on the Internet.
Experimentally, NPR Labs has normalized a large number of streams and listened to them over a private test stream in our Audio Lab, commuting in the car, even mowing the lawn (with ear buds, of course). My own impression is that normalization is easy to achieve and makes Internet streaming a more enjoyable experience.
The Consumer Electronics Association has established a working group, R07WG15, sponsored by the R07 Home Networks Committee, to evaluate techniques for improving listener satisfaction related to loudness. I look forward to working with the group and hope that readers will follow our progress and comment on their experiences.
John Kean is senior technologist, NPR Labs at National Public Radio.
Comment on this or any story. Email [email protected], with “Letter to the Editor” in the subject field.

