 The author is senior development engineer for Wheatstone Corp.
There’s nothing like a little audio performance testing to cap off a hectic week at the station, especially if you don’t have to haul out the heavy (read “expensive”) equipment to do it.
There are two main things I like to test: the flatness of the frequency response and the distortion added by equipment in the air chain. For this, you’ll need clean test signals and a way to measure those signals after they’ve passed through the air chain.
Measuring Distortion
Obtaining clean test signals is fairly easy. Most audio editing systems have the ability to synthesize low-distortion sine waves and then save them to a file.
I generate and analyze test tones using some software tools written by Sebastian Dunst, available from http://softsolutions.sedutec.de. Note that a license is required to use these tools in a “commercial” environment.
I use the SoftSolutions Multisine audio generator to synthesize single or multiple sine waves of any length or audio level, stereo or mono, and store them as a linear WAV file.
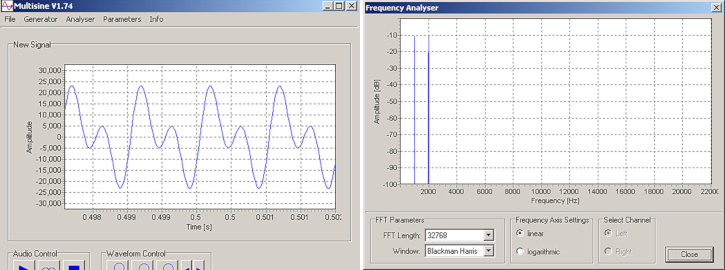
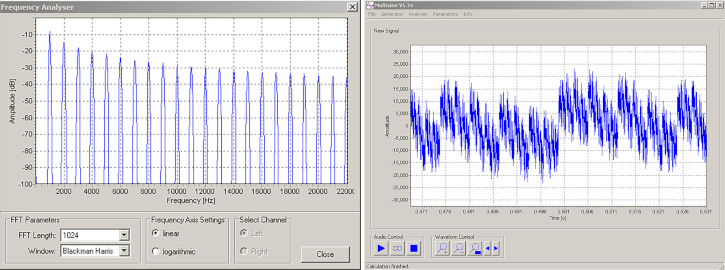
Fig. 1 is the waveform that has resulted from adding a pair of sine waves at 1 kHz and 2 kHz, both at equal amplitude, to create a test signal. Then, with the SoftSolutions AudioAnalyzer software, I can analyze audio saved as a WAV file and display the distortion parameters I’m interested in.
Fig. 2 is the spectral analysis of the waveform from the above example. This would be what we’d see if we had a perfect air chain.
[Read the Complete Oct. 20, 2021 Issue of Radio World Engineering Extra]
If these two pure sine waves are fed through an air chain with no distortion (which isn’t possible, yet — all circuits add distortion), the analyzer would show only the original two signals. As the spectrum analysis shows, the rest of the audio spectrum would be clean — no other signals would appear above the bottom of the display.
But if there were distortion, what would it look like? It might appear similar to Fig. 3, showing many other signals in addition to the first two we started out with. The example is of a severe distortion problem — this air chain would sound horrible on the air!
Frequency Response
The same tools we just used to measure the distortion within the air chain can also be used to measure frequency response.
This time we’ll use the same software tools to generate a test signal that has many sine waves. By then sending this complex signal through the air chain and then looking at it on the analyzer, we’ll be able to see if the sine waves (at different frequencies) are coming back at equal levels.
Fig. 4 is the waveform of a test signal made up of sine waves at 20, 40, 80, 160, 320, 640, 1280, 2560, 5120, 10240 and 20480 Hz. In a perfect air chain, the analyzer would show all of the signals at their original and equal levels after passing through the air chain.
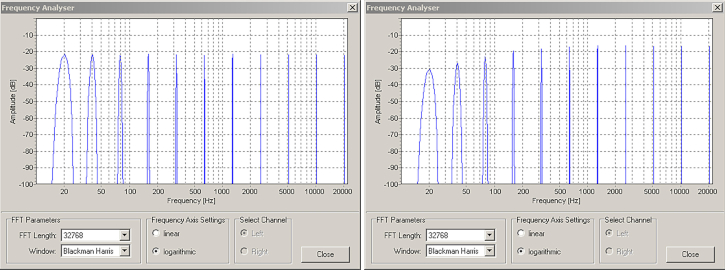
Fig. 5 shows that all of the signals are present and that they all reach the same audio level. This represents “flat” (good) frequency response.
What would the analysis look like if there were a loss of low frequencies due to, for instance, dried out electrolytic capacitors in some part of an analog signal path?
It might look like the next display, shown in Fig. 6. Note how the signals at lower frequencies are quite a bit lower compared to the mid and high frequencies. This station would have a “weak” bottom end, no matter what they tried to do with the audio processing.
[Subscribe to Radio World Engineering Extra]
There are many tools available, both hardware and software, that can be used to quantify the quality of the station’s air chain. Remember that it is not important which tools are used but rather that they are used to check occasionally to see if the station’s air chain is healthy.
If the air chain isn’t up to snuff, it doesn’t matter what audio processor, transmitter, STL or exciter the station has, because the on-air sound can never be better than that of the weakest link.