Every two years, the Federal Communications Commission is required to publish a Communications Marketplace Report that assesses the state of competition across the broader communications marketplace in the United States. The report includes everything from deep dives into the mobile wireless spectrum and cable industry prices to, more relevantly for our readers, a breakdown of annual revenue and programming formats of licensed broadcast radio stations in the country.
Throughout 2022, Radio World has continuously reported on the ever-evolving media landscape, focusing at-large on the lively debate about the future of the radio industry as technologies continue to advance and listening habits change.
We’ve reported on efforts to “save” AM radio as the classic format comes under siege with the rise of electric vehicles. We’ve dove into reports that assess smart speaker ownership, and how the technology can be used to a station’s advantage through online streaming. We’ve taken stock of how the radio and audio industries have been forced to adapt throughout the pandemic, and how the day-to-day operations of radio stations remain permanently altered. And finally, we have continued to tune into the conversation surrounding radio’s place on the car dashboard, and what the radio-automotive marriage will “look” like moving forward.
Radio World hasn’t been the only one collecting and stockpiling these observations for public consumption. In its 2022 Communications Marketplace Report, the FCC says, “The video and audio industries are also experiencing a great deal of change, as technological change and consumer preferences transform the marketplace.”
Below, you will find relevant takeaways from the commissions 2022 report; all of which assess the strength and diversity of the radio and audio industries at present, adding to the ongoing dialogue within our community.
Station count
In its report, the commission notes that the number of AM, FM and LPFM radio stations in the United States has remained relatively steady in recent years. This is because new stations are possible only through new allocations and award of licenses, either via auction, in the case of commercial stations, or a comparative system for non-commercial stations.
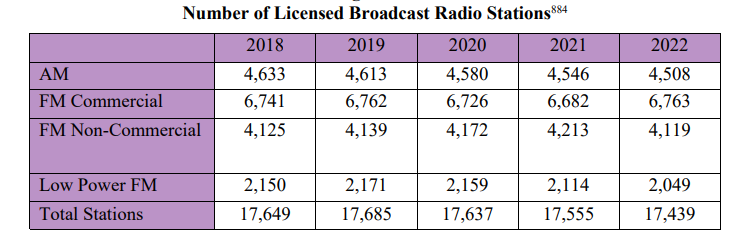
When making the decision to grant or deny a station license, the commission is charged with ensuring that stations are distributed across the country and licensed to communities in a manner that serves the public interest. This can often be a highly-contentious process, which Radio World continues to cover extensively.
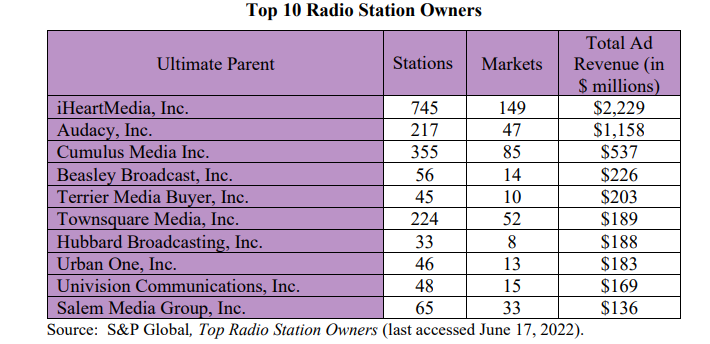
Top 10 radio station owners
In the report, the FCC lists the top 10 largest radio station owners, ranked by revenue. It says these owners control stations that are not confined to particular geographic regions; rather, their stations are spread across various geographical markets in the United States. As can be seen in the chart below, iHeartMedia continues to saturate U.S. markets with 745 stations, as compared to its runner up, Cumulus Media, with 355 stations. (Terrier Media Buyer is Cox Media Group.)
U.S. terrestrial radio revenue
The next chart shows the total U.S. broadcast radio revenue from 2005 to 2021. Total broadcast radio revenue was virtually flat between 2010 and 2019, going from $17.3 billion in 2010 to $17.8 billion in 2019, for an average annual growth rate of approximately 0.32%.
However, total broadcast radio revenue dropped to $13.7 billion in 2020, and then rose to $14.8 billion in 2021, resulting in a net decline of approximately 17% from 2019 to 2021. This sharp dip was largely due to lessened demand for advertising during the early years of the COVID-19 pandemic.
[Related: “Who Are the Top-Earning U.S. Radio Groups?“]
This data from the commission also shows that radio revenue never fully recovered from the decline experienced during the recession following the 2008 financial crisis.
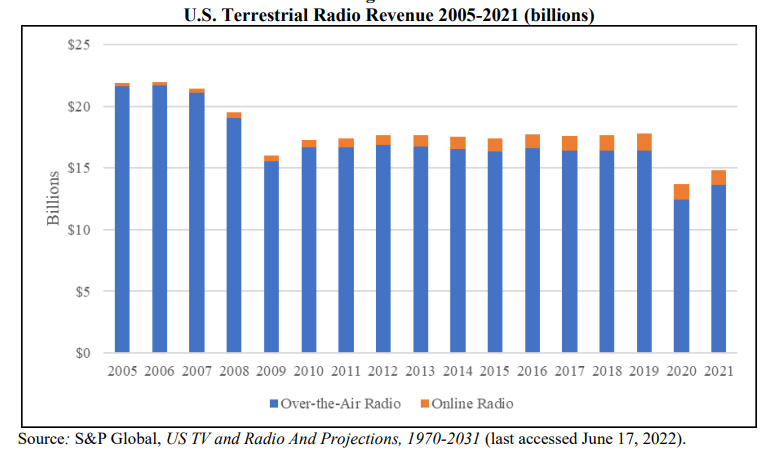
Further, the chart above breaks down radio revenues between over-the-air radio (which includes network, national spot and local spot advertising) and online radio (which includes online versions of radio broadcasts). Online broadcast radio has had more substantial revenue growth than over-the-air radio, i.e., a 13.1% increase between 2010 and 2019, notes the FCC in its report.
The share of revenue from online advertising grew from 3.6% in 2010 to 8.2% in 2021. Online radio is an area of potential growth for radio advertising revenue, especially given various new devices for accessing online radio including smartphones, tablets and smart speakers.
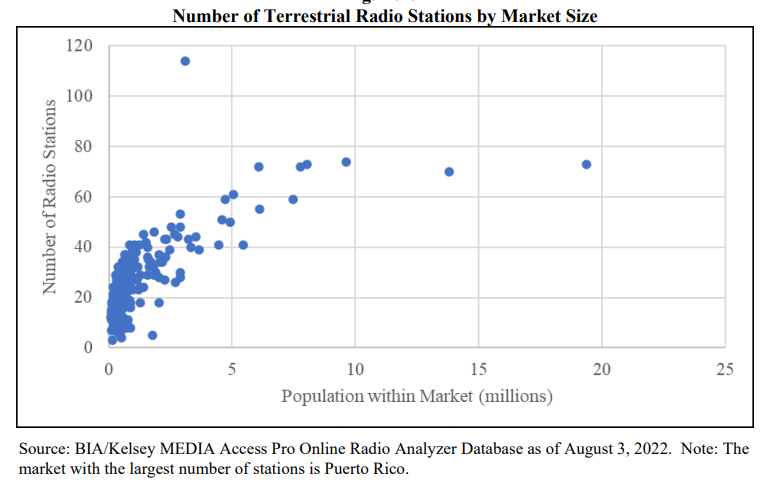
Stations by market size
Below is a scatterplot of the number of stations within a market against the market size, measured by population. The number of radio stations available generally increases as the market size increases, suggesting more choices in markets with higher populations. Not shown in the table, however, are additional choices that listeners have, including satellite and online radio.
Programming formats for terrestrial radio
The FCC has noted in various proceedings that AM broadcasting services face persistent interference issues. Such interference may have an effect on station format choice. AM stations favor talk formats relative to music formats, which are more common on FM stations, due to the superior sound quality of the FM service.
This is illustrated in the chart below, which presents the distribution of programming formats across AM, FM and LPFM stations. More than 60% of FM stations have a music format, while only approximately 35% of AM stations have a music format. However, AM stations favor Spanish and Ethnic, News, Sports and Talk formats relative to FM stations, according to data analyzed by the commission.
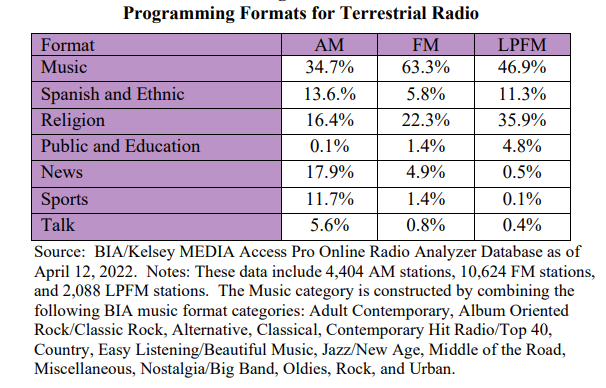
Nearly half of LPFM stations are classified as Music stations. Also, one-third of LPFM stations provide religious community programming (considerably more, in percentage terms, than AM or FM stations), reflecting local churches’ or local religious organizations’ use of the medium.
[Related: “FCC Commissioner Advocates for Preservation of AM Radio“]
U.S. terrestrial and online radio weekly audience
While terrestrial broadcast radio remains dominant in some respects, the gap in usage between broadcast and online audio programming has declined over time.
The chart below shows that the number of weekly listeners to broadcast radio in the United States has remained relatively stable while the audience for online audio programming grew steadily. Data shows that, over the past decade, the number of listeners to terrestrial broadcast radio grew annually around 0.55% on average, while the annual growth in online audio listeners was 29%. However, it is important to note that online audio programming includes AM or FM broadcasts accessed online.

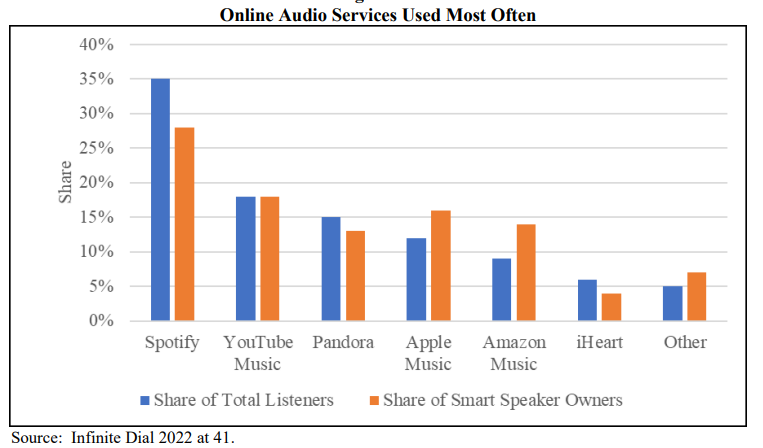
Online audio services used most often
Smart speakers have emerged as important devices for accessing audio programming in the home or office and staying connected through difficult times. A recent survey conducted jointly by NPR and Edison Research reported that, in 2022, 35% of Americans aged 18 years and older (approximately 100 million people) own at least one smart speaker, an increase from 32% in 2021.
The joint NPR-Edison survey also reports that the number of smart speaker owners who listen to a podcast on their smart speaker in a typical week has increased by 22% over the past 5 years. Further, the study reports that the share of time listening to audio programming through a smart speaker increased 400% from 2017 to 2022, and the share of time listening to podcasts through a smart speaker increased 200% over the same time period.
[Related: “Smart Speakers Can Restore Radio’s Relevance“]
The final chart below shows the share of all listeners who listen to a particular audio streaming service and the share of smart speaker owners who listen to the audio streaming service.
You can read the full report here. The discussion of the audio market, including radio, appears in paragraphs 295 to 328.
[Read the FCC’s previous Communications Marketplace Report from 2020]