The author is vice president of engineering, Dielectric LLC. This article is based on a paper prepared for the NAB Broadcast Engineering and IT Conference of the NAB Show and is published with permission. Proceedings of the conference are available at https://nabpilot.org/beitc-proceedings/.
Abstract: There are approximately 900 Class A directional FM stations licensed in the United States. Many reasons exist to directionalize an FM antenna, including maximizing signal coverage over a designated market area (DMA), reducing lost signal over unpopulated areas, shaping the pattern to fit within the station’s authorized footprint and conforming to the rules stated in Title 47 CFR 73.316.
Currently, applications proposing the use of directional antenna systems must include a tabulation of the antenna pattern through measurements performed on a test range of either full scale or 4.4:1 scaled model setup.
It has been requested that the FCC acknowledge that the public interest will be served by the commission accepting computational modeling of directional FM antennas in lieu of physical measurements of antenna characteristics and/or performance for purposes of applications and licensing.
Products such as Ansys HFSS are 3D electromagnetic (EM) simulation software tools for designing, simulating and evaluating high-frequency electronic products such as antennas, antenna arrays and RF or microwave components. The use of 3D high-frequency simulation will in many ways yield results that are superior to traditional range measurement proofs, in terms of accuracy.
Since simulations are done in a true free-space environment, any issues with the range or anechoic chamber and with the surrounding environment are eliminated, resulting in more reliable azimuth patterns and H/V ratio.
The use of software also eliminates the lengthy setup and take down time of models as well as the need for a technician to adjust the model and take data points by hand, thus removing mechanical tolerances and human error affecting the data.
Another advantage of designing in a virtual environment is that the geometry can be completely optimized and not compromised by time, materials and tolerances.
This paper will go into detail on the many benefits illustrating why the FCC should authorize the use of 3D high-frequency simulation computer modeling to demonstrate that a directional FM antenna performs as authorized.
Introduction
The rule for licensing of FM directional antennas is found in §73.316(c)(2) and §73.316(c)(2)(iii) of Part 47 of the Code of Federal Regulations. It states that applications for license upon completion of the antenna construction must include a tabulation of the measured relative field pattern.
Read literally, since it asks for a tabulation of the measured relative field pattern upon completion of antenna construction, this language would seem to imply that an FM antenna must be measured after installation, through field measurements of the installed antenna, which can be quite impractical to make and would have been more so at the time that the rule was adopted in 1963.
Consequently, we assume that the rule was interpreted initially to require that FM directional antennas be measured on full-size test ranges, since such ranges were available then for characterizing both the azimuth and elevation patterns of broadcast television antennas.
In 1976, Matti Siukola, RCA scientist and unit manager of advanced development for RCA Broadcast Systems, presented his paper “Pattern Optimization of FM Antennas” at the NAB symposium.
Siukola proposed parasitic elements to be used as directors or reflectors in either horizontal or vertical positions to directionalize a simple FM antenna. In the same paper, Siukola also proposed the more economical use of scale modeling.
It has now been 45 years and basically nothing has changed regarding FM broadcast pattern verification. Interestingly, characterization of azimuth patterns has evolved in all other broadcast services such as AM radio and television.
The commission has a history of accepting computer modeling
The procedures required or allowed by the FCC for characterization of antenna azimuth patterns vary quite markedly between broadcast services: AM radio, FM radio and television.
It is notable that, while the rules for directional antennas for FM and TV were similar at their initial publication in 1963, there were a few significant differences between them that have led to different procedures over the years.
The most significant difference between the two approaches to directional antenna rules was that the FM rules required a “means (such as a rotatable reference antenna) whereby the operational antenna pattern will be determined prior to licensed operation and maintained within proper tolerances thereafter,” while the TV rules had no such requirement.
So, while the FM rules required a method for producing a “proof of performance” on the antenna prior to its use and for its maintenance over time thereafter, the TV rules did not.
The main difference between the two sets of 1963 rules is that the FM rules require that measured pattern performance data for a directional antenna be submitted as part of the application for a license to cover the corresponding construction permit once the antenna has been installed. The current TV rules (including the DTV rules) only require pattern data for a construction permit and don’t define whether that data must be derived through measurements or can be the product of calculations. The real-world results of this rule difference are that directional TV antennas and their patterns are specified almost exclusively using calculations, which, over time, have migrated to computational modeling of the antennas.
When comparing the three fundamental broadcast services and the treatment of their directional antennas in the commission’s rules, the AM antenna rules were updated over a decade ago.
In 2008, use of the Method of Moments (MoM) computer modeling, based on the Numerical Electromagnetic Code (NEC), was permitted as pattern verification for AM services. This approach provides considerable savings in time and cost for antenna manufacturers and ultimately for the broadcasters who purchase the antennas.
As discussed above, the TV/DTV rules already are flexible enough to permit use of computer modeling both for the design of antenna patterns and for the testing of the antenna’s performance without the need for physical models. That leaves only directional antennas for FM broadcasting with the requirements and burdens of having to go through the steps of first building models of antennas, measuring those models and collecting the related data.
RF Computer Modeling Outside the Broadcast Industry
Not only has the commission approved software modeling for AM directional antenna array proof of performance, but it has approved proof of performance for medical devices and RF radiation exposure evaluation of portable devices as well.
The high level of accuracy that simulation software provides has allowed a wide range of RF device manufacturers to significantly reduce the cost and time associated with proof of performance to the commission.
Computer Modeling — Repack
The timeline of the broadcast repack created a unique situation in the industry. Since many broadcasters needed new antennas and RF systems in a short amount of time, creative engineering solutions to reduce lead time had to be found.
The adoption of 3D high-frequency simulation to gather impedance, phase and amplitude data allowed for expedient antenna design and eliminated many limitations. This process has been successfully used at Dielectric to design more than 1,000 antennas since the beginning of the repack.
In addition, electrical design time was reduced from several weeks to less than three days. The manufacturing space needed to store physical models and house anechoic chambers has been repurposed to further accommodate manufacturing needs. This process has proven to produce more accurate designs, which is evident in the reduction of test time needed to bring the full antenna into specification.
It is safe to say that, without the use of virtual simulation, it would have been essentially impossible to design, manufacture, test and install the nearly 1,000 antennas that had to be replaced to complete the Post-Incentive Auction Spectrum Repack in the minimal time allowed for the process.

It is worthy to note that, in the television spectrum repack, as some TV stations moved from UHF to Low-VHF, they needed new directional Low-VHF antennas. In several cases, the designs used were those of FM directional antennas scaled to be larger, to work at the lower frequencies of TV Channels 2.6.
Because they were to be licensed for use by TV stations, the new Low-VHF antennas could be developed and proved with all the latest computer modeling techniques for design, manufacturing and testing. Had those very same antenna designs and patterns been constructed for the purpose of use a few MHz higher, in the FM band, only because of the differences in the FCC rules, it would have been necessary to physically model them prior to building them and to physically measure them to collect data for submission to the FCC during the licensing process.
Fig. 1 shows a quadrupole ring antenna typically used for FM broadcast design for the use at TV Channel 3.
Range Measurement Accuracy
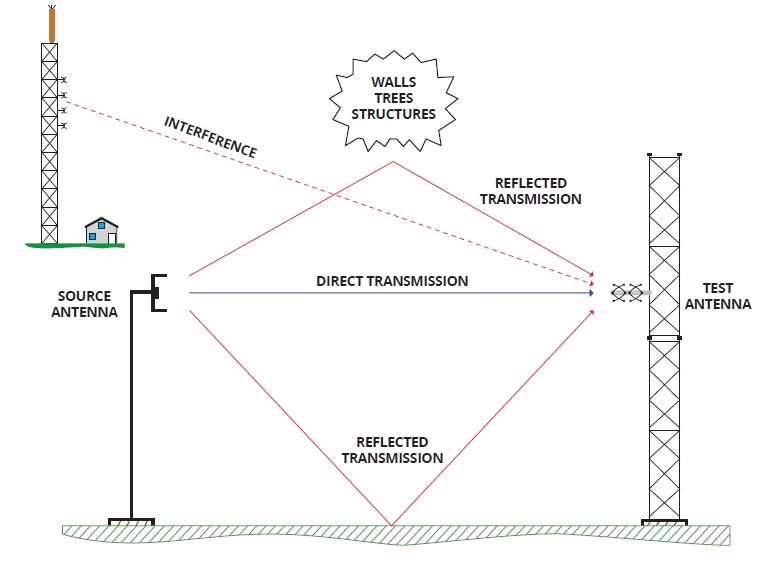
An important part of range antenna pattern measurements is the alignment and reflectivity of the range. Alignment typically relies on mechanical bore sighting with the assumption that the antenna used to transmit the signal to the device under test (DUT) is perfectly electrically aligned. Alignment accuracy is therefore limited by both mechanical and electrical constraints.
The principle reason for the pattern to deviate from what would be expected from an idealized range are reflections from the range surface, surrounding objects, the positioner and the cables used to feed the antenna. Sometimes signals from external sources also pose a problem. The field at a point in the aperture under test is the phasor sum of the test signal and the extraneous signals. The relative amplitudes and phases of the desired and extraneous signals will vary with position along the test aperture causing constructive and destructive additions, thus producing a measured pattern that will depart from the free space expected pattern. (See “National Association of Broadcasters Handbook, 11th Edition,” 2018. Chapter 10.8, “VHF and UHF Television Antenna Test Range Measurements,” John L. Schadler.)
Range measurement accuracy limitations are removed with the use of computer simulation.
Mechanical Tolerancing and Human Error With Physical Modeling
Software eliminates lengthy setup and take down of models as well as the need for a technician to be physically present to adjust the model and take data points by hand. Accuracy is improved greatly using simulation as it removes mechanical tolerances and human error affecting the data. Information that is traditionally recorded by hand, such as radiator location and parasitic sizes and locations in space is replaced by a simple exportation of the computer model. The full three-dimensional model can be sent directly to 3D CAD software for detailed component manufacturing and installation instructions, eliminating the possibility of documentation error and physical measurement inaccuracies.
Automated Optimization
Another advantage of designing in a virtual environment is that the geometry can be completely optimized and not compromised by time, materials and tolerances. Variables can be automatically adjusted, and complete data tables exported for the next step in the design process. This is done through an artificial intelligence. An optimetric setup can simultaneously solve any combination of pattern shapers, parasitics and radiators positions in space to find best fit solutions. Trial and error techniques traditionally used to develop the geometry necessary to produce a desired pattern is replaced by this artificial intelligence optimetric process. Criteria are set based on the desired azimuth and FCC regulation and multiple antenna configurations can be run in parallel to reduce overall study time.
Significance of Polarization Ratio
The rules under 47 C.F.R. §73.316 state that the supplemental vertically polarized effective radiated power (ERP) required for circular or elliptical polarization shall in no event exceed the effective radiated power authorized.
Since in most cases, broadcasters consider the vertically polarized component more important than the horizontal and tend to maximize their vertical signal, accurate polarization measurements are important.
Range measuring the polarization ratio at any point in space with accuracy is difficult. Since no range is completely free of reflection and the fact that horizontal and vertically polarized waves reflect differently, the accuracy in the ratio is limited by the range reflectivity. Polarization ratio range measurement accuracy is also limited by the transmit antennas horizontal and vertical polarization pattern congruency.
If the transmit antenna is linearly polarized and is spun from horizontal to vertical for polarization tests on the DUT, the assumption is that the beam is perfectly straight and has no wobble. If separate radiation paths are used to measure the polarizations, such as switching between crossed dipoles, the assumption is that each of the patterns and gains of the two paths are identical.
Each of these sources for error is eliminated with the use of 3D high-frequency simulation.
Comparison of Physical Model Measurements and Computational Simulation
To show the validity of computer modeling in place of physical modeling of FM directional antennas, an example design using both methods, i.e., physical modeling and computational modeling of the same antenna, are compared.
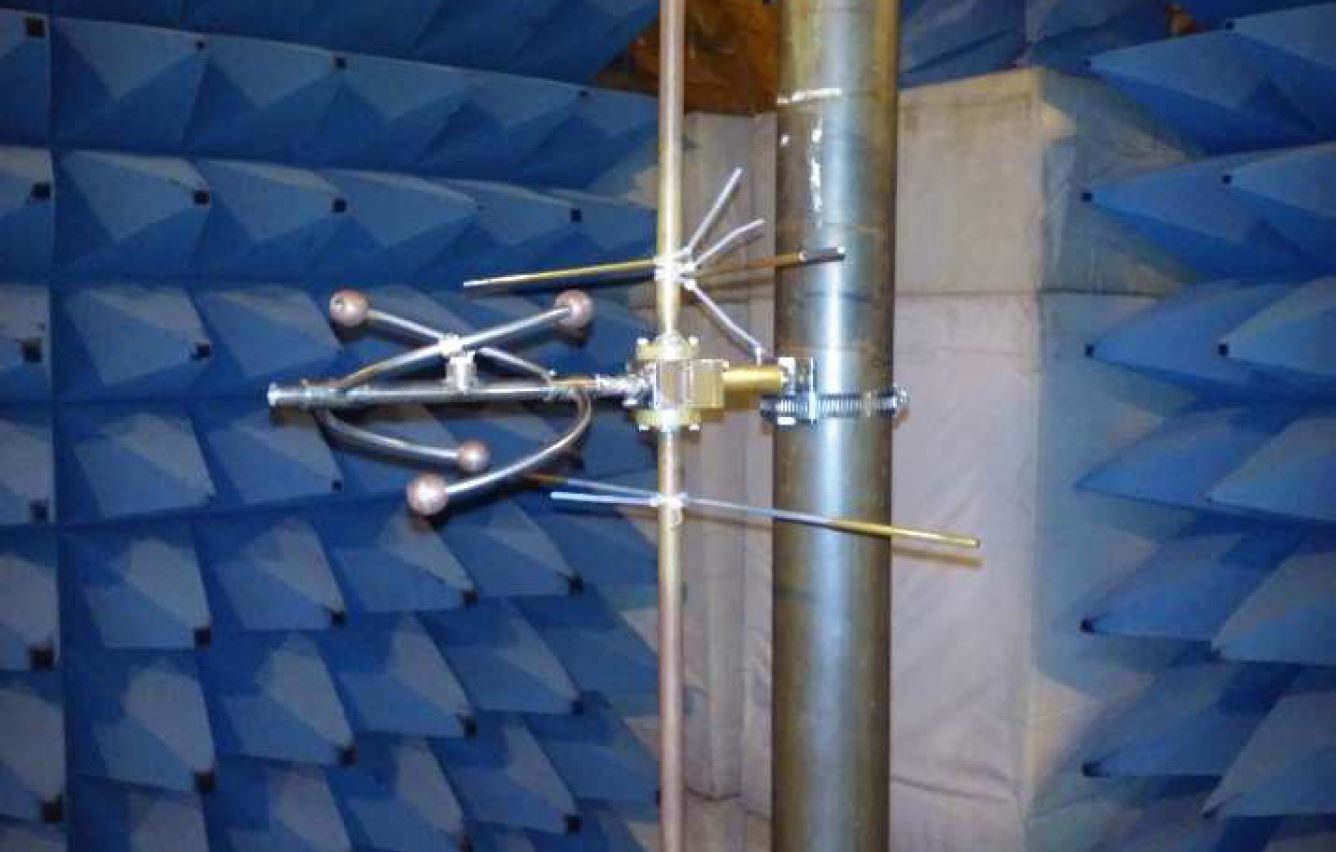
In the example design, a directional pattern study for Station WHEM, 91.3 MHz, Eau Clair, Wis., was performed on a scale model FM test range using a scaling factor of 4.4:1 for all elements involved in the study.
The scaled elements included a model of an antenna bay and identically scaled models of parasitic elements and the mounting pipe to be used by the station. All the scaled model components were rotated through 360 degrees while receiving a signal at the appropriately-scaled frequency from a linear cavity-backed source antenna.
The horizontally and vertically polarized azimuth patterns were measured in an anechoic chamber test range. The signal source and scale-model antennas were mounted at identical elevations and at opposite ends of the test chamber. A network analyzer was used to supply the RF signal to the source antenna at 4.4 times the fundamental FM frequency (i.e., at 401.72 MHz) and to receive the signal intercepted by the antenna under test.
A photograph of the scale-model pattern study configuration is shown in Fig. 4.
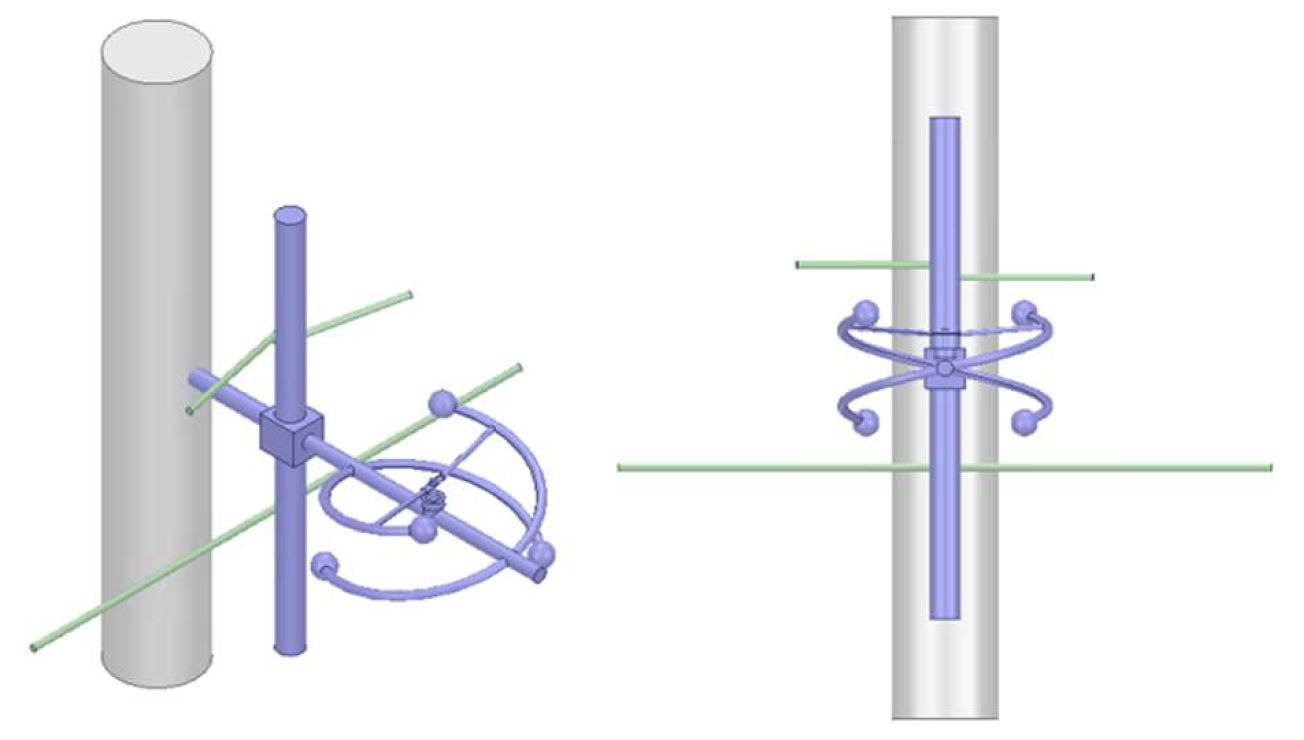
This directional pattern study was replicated in the Ansys HFSS environment using the full-scale CAD model of this antenna bay, mounting pipe and parasitics at the fundamental frequency of 91.3 MHz six years later. See Fig. 5.
The original results of the scaled model directional pattern study were accepted by the customer and demonstrated both proof of performance and FCC pattern envelope compliance in both the horizontal and vertical planes. A statistical measure of the relationship between two sets of data can be analyzed using the correlation coefficient (r). A correlation coefficient of r = 1.0 represents a perfect match. It can be used as the figure of merit to determine how closely the range measurements match the HFSS calculations.
![\[ \frac{\upSigma ( x_{i} -\overline{x})( y_{i} -\overline{y})}{\sqrt{ \upSigma ( x_{i} -\overline{x})^{2} \upSigma ( y_{i} -\overline{y})^{2}}} \]](https://www.radioworld.com/wp-content/ql-cache/quicklatex.com-577574cc38cb2c65744f3047c5000740_l3.png "Rendered by QuickLaTeX.com")
Where:
xi = x values in sample
x̅ = mean of the x value samples
yi = y values in sample
y̅ = mean of the y value samples
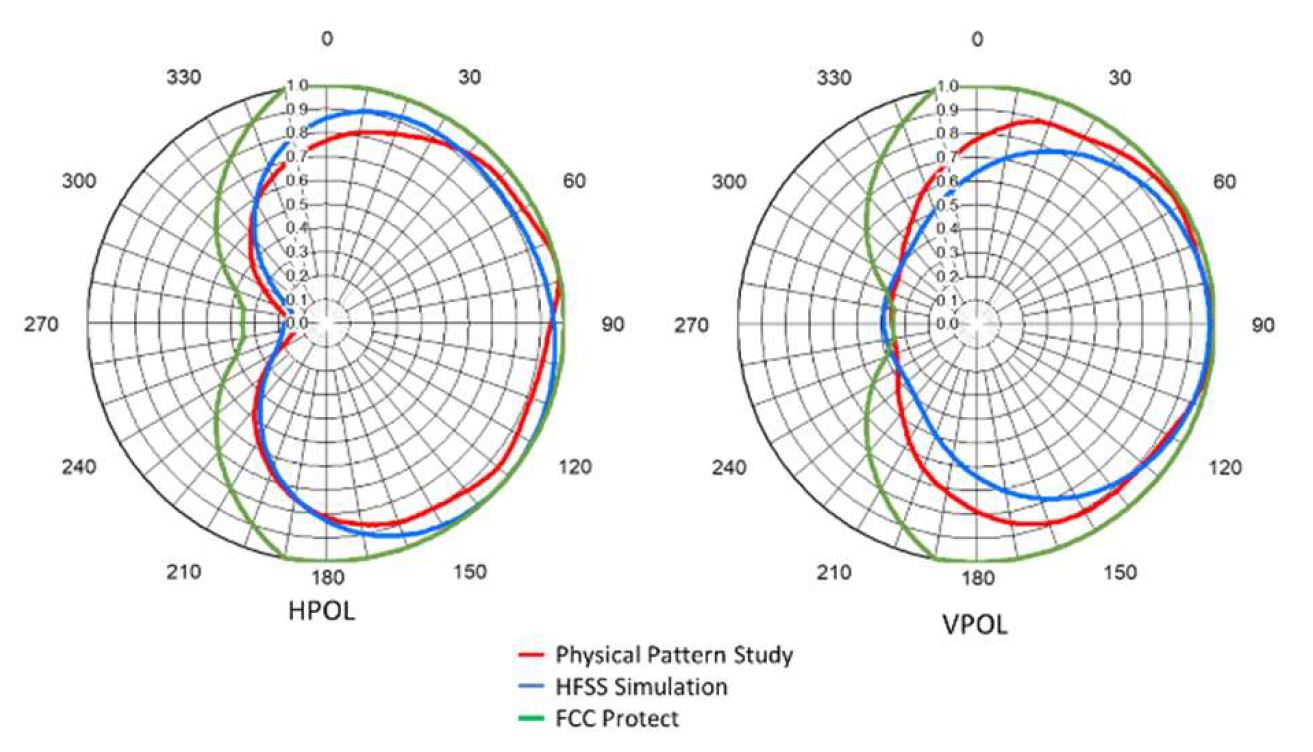
Fig. 6 displays the overlaid horizontal and vertical polarization patterns and the FCC pattern mask. As can be seen, the results of the Ansys HFSS directional pattern study very closely match the results of the scaled model study.
The horizontal polarization azimuth pattern for both the scaled model study and the simulated pattern study have a maximum deviation of 1.67 dB and a minimum deviation of –1.39 dB compared to the scaled model study. The correlation coefficient for the horizontal polarization is 0.986 and 0.960 for the vertical polarization. The figure also shows that the computationally simulated antenna exceeds the FCC pattern mask in the vertical polarization pattern by a minimal amount. It must be noted that if computer modeling was used in 2015 at the time of this study, modifications would have been made to bring the vertical component inside the FCC protect.
Conclusion
The tools that were available when the current rules for FM directional antennas were developed in 1963 only included full-size or scaled modeling of antennas, combined with physical measurements, to approximate the characteristics that would be obtained when an antenna was installed.
In the decades since then, computational methods have evolved to enable more accurate and precise predictions of the antenna performance. The FCC has for decades relied upon manufacturers of FM directional antennas with engineering personnel who can apply the necessary skills to design and test broadcast antennas. The basic knowledge, experience and expertise requirements with respect to antenna design and modeling remain the same when the newer computational modeling techniques are applied as was the case prior to their availability.
It therefore stands to reason that the manufacturers of FM directional antennas should be permitted to apply the new tools at their discretion and that the FCC should accept the results of computational modeling as being just as valid as the results from physical construction and measurement of either full-size or scaled models of antennas.
A special thank you to S. Merrill Weiss, president of Merrill Weiss Group LLC, for his contributions to this topic. He is responsible for the writing and submission of the Petition for Rule Making to the FCC, “Computational Modeling of FM Directional Antennas.” Portions of this paper are based on that work.