Nick’s Signal Spot is a new feature in which Nick Langan explores RF signals, propagation, new equipment and related endeavors.
When the calendar turns to May, I must confess, I can feel it in my bones.
It is a sense of excitement that, even after avidly listening to long-distance signals on the FM radio band for 21 years, I still enjoy each year: the dawn of another Sporadic-E season.
But while the month of May is a guidepost, when exactly the skip will begin in earnest is anyone’s guess.
In the prolific E-Skip season of 2021, for example, an opening of more than 30 minutes in length with a maximum usable frequency into the FM broadcast band took place on May 8 here in New Jersey, kicking off a very active month.
May 8 also was the date that skip into FM started here last year. Other seasons, such as the memorable 2018 campaign, did not truly get underway until June.
As I’ve covered before, there is so much mystery to the E-Skip propagation form. A new data deep dive by amateur radio operator and avid long-distance signal enthusiast (DXer), Loyd Van Horn (W4LVH), attempts to make sense of it all.
We’ve made mention of Van Horn before, but he deserves a larger profile. He was raised in a radio family, the son of Larry Van Horn (N5FPW). Larry was the publisher of Monitoring Times magazine for 20 years until the publication closed in 2013.
Larry wrote for 30 years in total there and, over his time, authored nine radio hobby books and many more technical articles that left a mark on the hobby up until his passing in 2023. Loyd’s mother, Gayle (W4GVH), is the author of the Global Radio Guide.
For six years, Loyd Van Horn has hosted DX Central, an interactive streaming series where he hosts live DX sessions on both mediumwave and FM, alongside equipment reviews, airchecks and how-to videos.
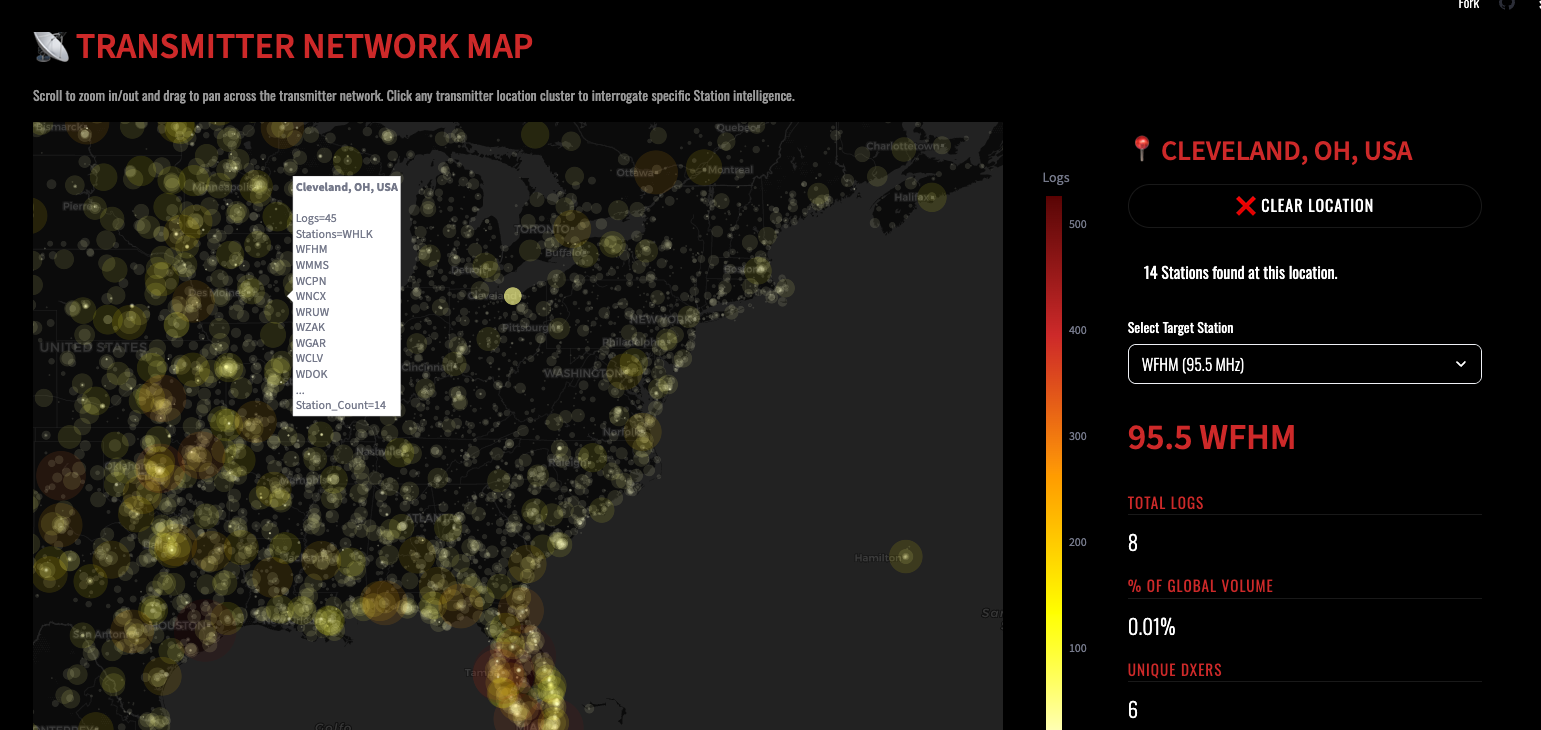
Now, Van Horn has tapped into an affinity for data to unveil the Sporadic Es Data Analysis Project, which launched on May 1.
The Sporadic Es Data Analysis Project
Based in Mandeville, La., Van Horn, 46, frequently works with big datasets for his day job. But for this E-Skip analysis project, he relied heavily on the capabilities of Google Gemini to help implement data tools such as BigQuery and Streamlit.
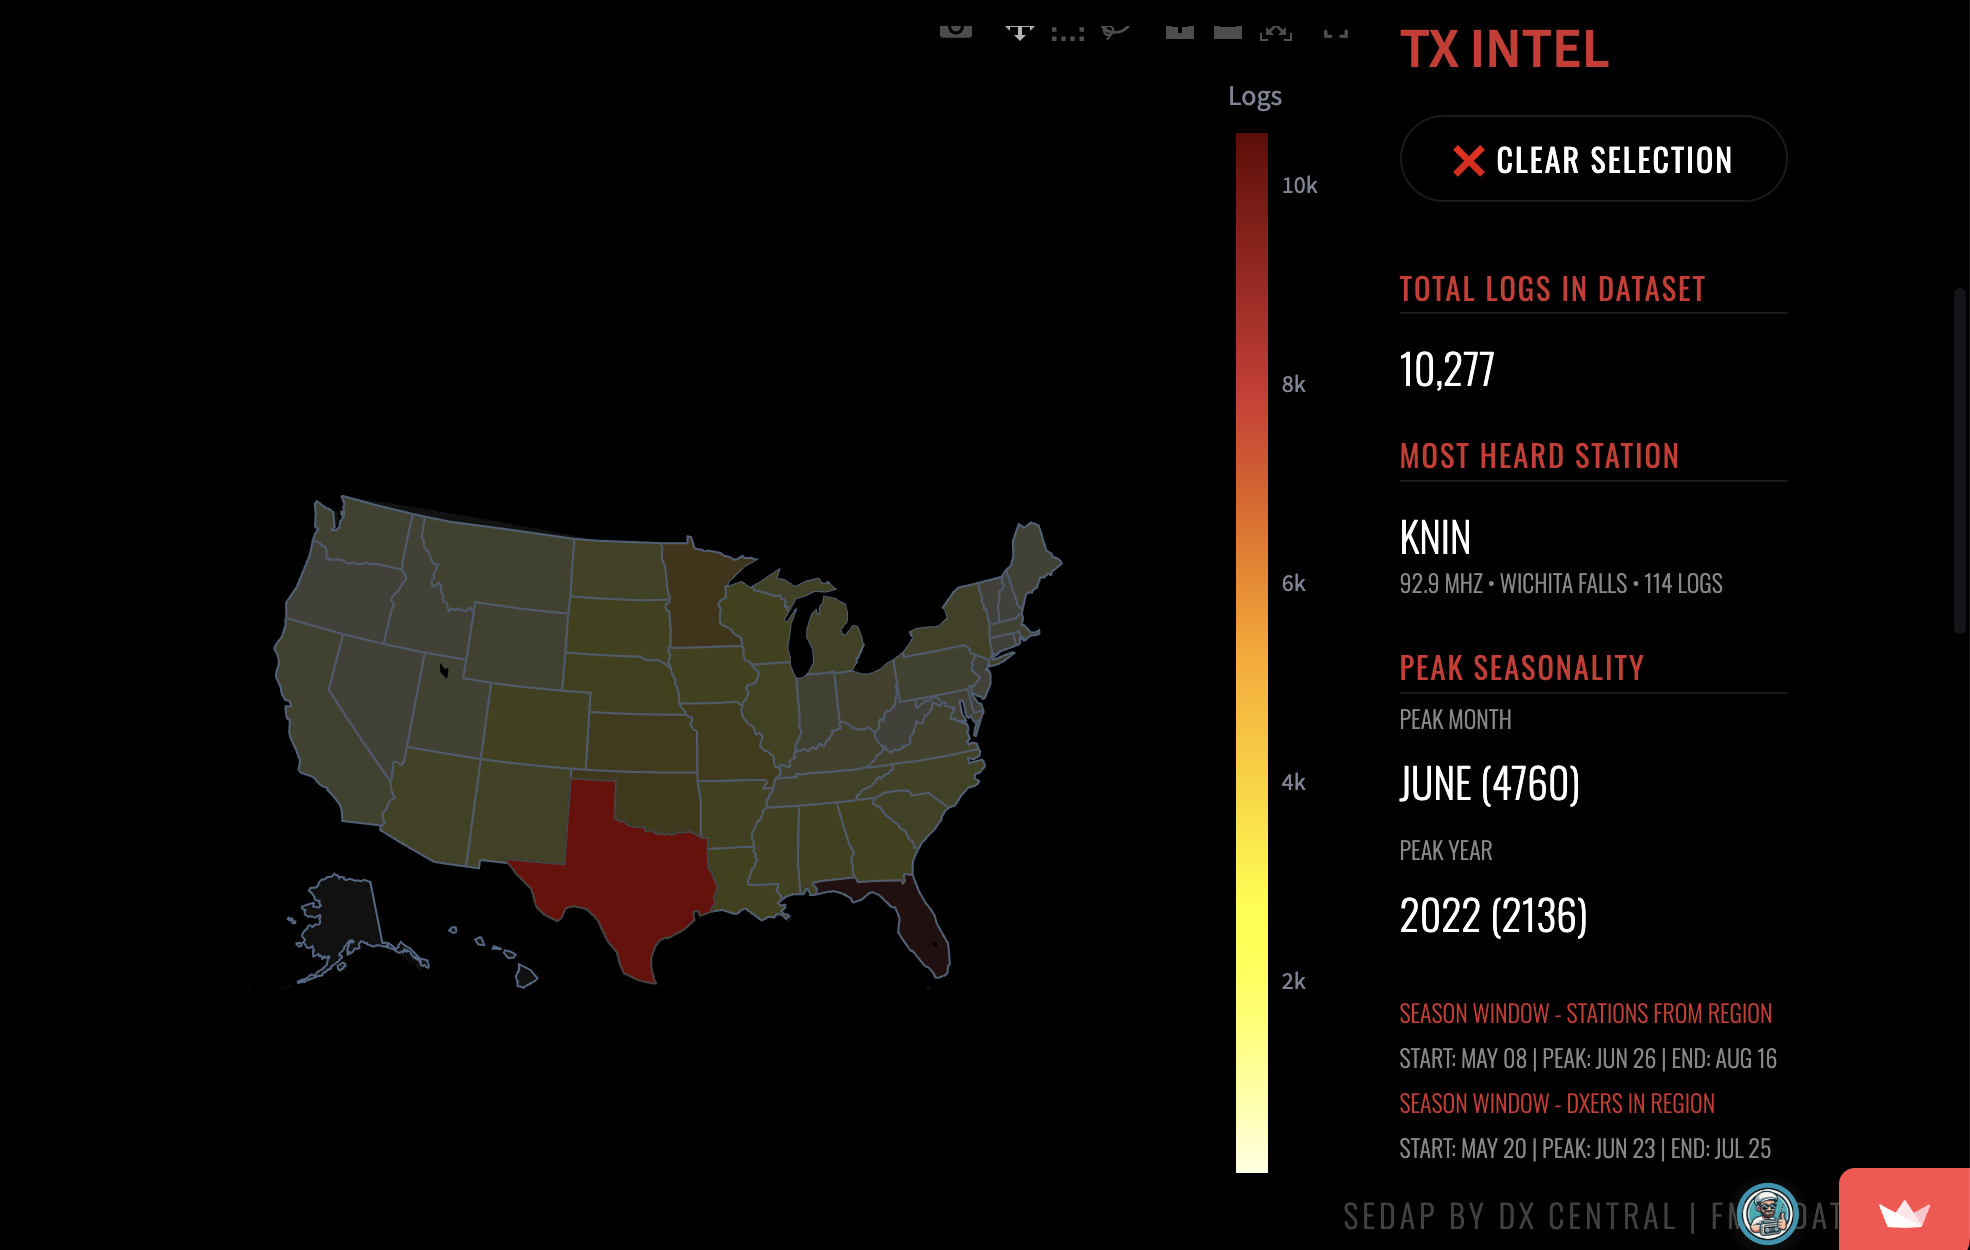
Van Horn used the logs available from FMList from 2017–2025, and he limited the data to North America, with permission from FMList creator Günter Lorenz. The data encompasses 247 individual DXers from 49 U.S. states.
“I learned on the job,” Van Horn told us.
Then, he used technical and RDS data from the Worldwide TV-FM DXing Association’s database to complement the logs.
We have shined a light previously on the pioneering work of Pat Dyer (WA5IYX), who diligently maintained his own dataset from 1972–2016. But a comprehensive analysis such as Dyer’s is hard to come by.
“Historically, analyzing Sporadic-E propagation on the FM band has been an isolated effort, with individual DXers tracking their own localized season-over-season metrics and comparing notes with other DXers,” Van Horn explained.
So, the end result is his project that Van Horn believes will serve both long-distance hobbyists and industry professionals alike.
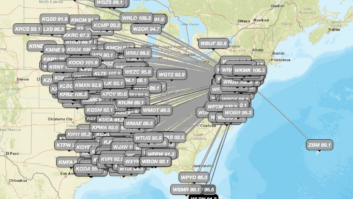
The most notable feature is the E-Skip cloud tracker. Users can select a specific date or date range and play back where skip clouds formed. Openings can be played on a timelapse, allowing DXers to watch a simulation of the Es clouds as they develop, morph and transit throughout the day.
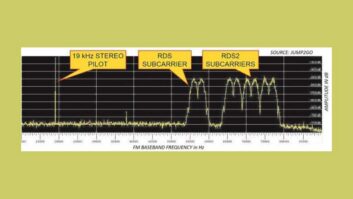
Broadcasters, meanwhile, might be interested in the station and RDS intelligence built into the platform. DXers often log stations by their RDS program identification codes. How well is your station’s RDS carrier getting out? It can be quantified here.
The goal, Van Horn said, was not to rate which season was better — particularly given the growth in reporting DXers using software-defined radios over the period — but rather to help DXers strategize antenna placement, bearing, timing and potential paths based on different periods within the season.
“This is about improving our understanding of what happens when the ionosphere sends those FM signals back down to Earth,” Van Horn said.
For the science of it all
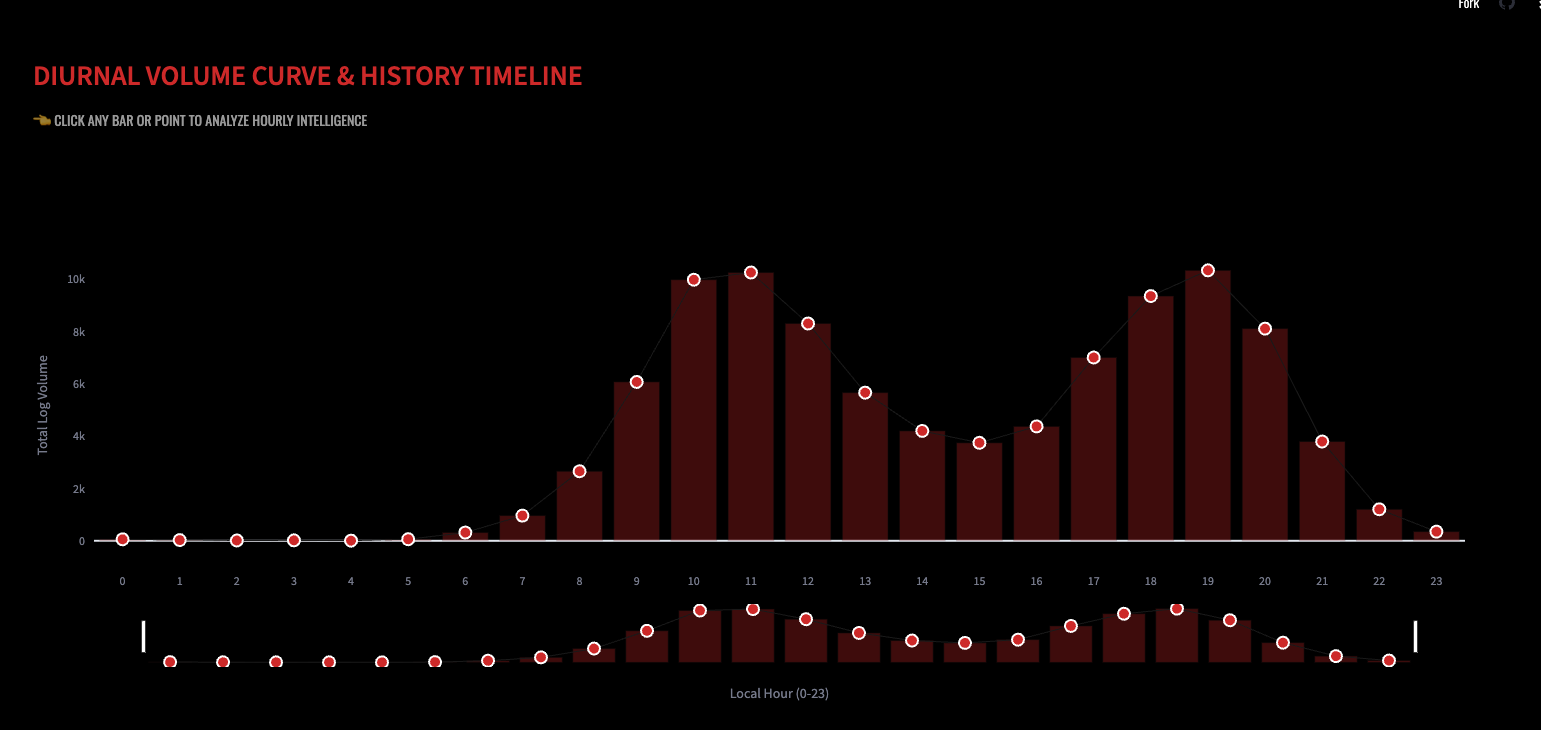
While the current iteration of the project offers intriguing insights, Van Horn is already mapping out the next phase. The roadmap includes expanding the dataset by integrating additional FM log sources, including WTFDA’s WLogger, Dyer’s historical archive and direct user-submitted logs.
Van Horn said he also aims to incorporate 6-meter amateur radio data. Doing so, he explained, will allow the platform to analyze days that saw no propagation activity alongside days that experienced active openings, but where the maximum usable frequency simply did not break high enough to enter the FM broadcast band.
Ultimately, he said the goal is to feed this multi-layered dataset into a machine learning model.
“And spot any trends or correlations that we just can’t see as humans,” Van Horn said.
And perhaps, a way toward making sense of the mystery of E-Skip.
[Read the Signal Spot from Nick Langan for More DX-Related Stories]