More radio broadcast engineers are carrying RF spectrum analyzers these days. Analyzers are no longer the domain of television engineers and laboratories.
My analyzer is an IFR A7550 which, I understand, is no longer in production. It is, however, the favorite of my friends who do radio engineering.
June of 1988 is when I mustered up the courage and about $10,000 to purchase the unit. Once I learned how to run it, the spectrum analyzer quickly became one of the most used pieces of test equipment I own.
On the bridge
A friend, Jim Stanley, clued me in on return loss bridges. These marvelous three-port devices can literally paint a VSWR picture on the spectrum analyzer’s display.
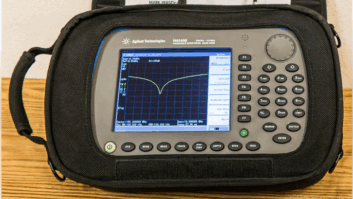
To run one, connect the spectrum analyzer’s tracking generator to one port, the spectrum analyzer’s input to another port and an antenna or some other load to the sample port. When the sample port sees a 50-ohm load with no reactance, the “return loss” is high, causing the displayed signal to be low on the screen. Conversely, when the load is an open or short, the displayed signal is higher up on the screen.
You actually use a short circuit as a reference. All readings are taken in dB below this level. When looking at an antenna that is well-matched at the center frequency, you see a dip in the response at the center of the screen and the trace rises on both ends. It is the Voltage Standing Wave Ratio, or WVSR, response curves that you see in antenna specification sheets.
Using the return loss bridge, you easily can tune antennas and instantly see the change in the quality of the match at the frequency of interest and at the surrounding frequencies. It is the kind of tool that everyone wanted years ago when the technology wasn’t there to produce one.
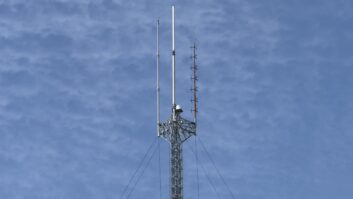
I recently performed troubleshooting on a 10-bay ERI FM rototiller antenna using my spectrum analyzer and return loss bridge. The transmitter was putting 20 kW into the transmission line and 1 kW was reflected. This represents a return loss of 13 dB.
The VSWR was 1.6:1. Normal reflected power, in this installation, is 100 watts or 33 dB of return loss for a VSWR of 1.05:1. The spectrum analyzer and return loss bridge verified the wattmeter and VSWR measurements.
A tower crew did a visual inspection of the antenna and it revealed nothing. There wasn’t even an air leak.
Grabbing hold
The spectrum analyzer and return loss bridge puts less than 1 watt of RF energy into the antenna, so it was safe for a tower climber to be near the antenna during testing. I had one tower climber put his hands on the bottom bay of the antenna and saw the return loss change. He climbed up and did the same on the next bay up and so on until the eighth bay, where there was no change when he touched the bay.
The same was true of the ninth and tenth bays. If only one bay showed no change, then I would have suspected that particular bay. In this case, the problem pointed to the inter-bay line between bays 7 and 8.
Sure enough, the crew opened that one line section and found a burned-out center conductor. It probably happened from a lightning strike.
They lowered the line to the ground, where I repaired the center conductor and cleaned the section. They had it reinstalled in short order and the antenna was back to normal.
This measurement method took the guesswork out of the troubleshooting. It saved the client $1,000 or more in tower climber costs and a half-day or more of off air time.
As it turned out, the station was off the air for only a few hours for the complete troubleshooting and repair.