This is Part 7 of an eight-part series. These articles are based on excerpts from the Society of Broadcast Engineers CBNT/CBNE Study Topics webinar series, designed to assist those seeking SBE certification and to provide others a broad overview of IT as used in broadcast engineering. (The series starts here.)
Resolving network issues is one of the most stressful situations that the broadcast IT engineer faces. It feels easier to pinpoint the root cause of an outright outage than a problem with performance degradation. Complaints such as the “network is slow” or the audio stream is buffering at times can prove far more challenging.
Troubleshooting of any system involves a few basic logical concepts or steps.
The IT certification organization CompTIA offers a six-step methodology that begins with a clear identification of the problem and ends with documentation of the outcome actions and findings. At all costs, you want to avoid a “shoot from the hip” approach or randomly applying whatever fix that might come to mind. This approach often leads to injecting new problems masking the original root cause.
The data flow layers of the OSI model provide an excellent structured approach. At the Physical or layer 1 the focus is on Ethernet cabling, which often accounts for the majority of problems in a network. Cabling issues can involve many variables, from improper installation to sub-par or inferior products being used, or post-installation damage. The network based upon Category 5e Ethernet cabling that works perfectly at 100 Mbps can fail when operated at 1,000 Mbps or GigE data rates.
A common installation parameter often overlooked is the maximum segment length. Whereas well known as 100m in length, the patch cables or jumper cables at the cabling ends are often overlooked in the overall segment length calculations.
Improper installation may also include running Ethernet cables parallel to electrical cabling rather than crossing electrical cables at a 90-degree angle to minimize any magnetic field interference to the Ethernet signaling. Kinks and sharp bends can also impact performance especially at 1 GigE data rates.
Use of the wrong connector or termination jack can cause performance issues, where a solid conductor twisted-pair cable is terminated with a connector designed for stranded conductor cable or a stranded conductor cable is terminated with a connector design for solid conductors.
There are RJ-45 connectors that are compatible with solid or stranded conductor cables, but are often more expensive. Gold-plated contact connectors will outperform lower-cost tin-plated contacts due to corrosion likely with the tin plating. It is also important to maintain the proper twist count per inch for the cable category when terminating.
Inferior products can include cabling that does not fully meet the category specifications of the EIA/TIA. The use of copper-clad aluminum conductors rather that solid copper conductors is a common method to reduce cable cost. Over time, the copper-clad aluminum cable is more likely to degrade and present problems due to oxidization of terminations.
When Power over Ethernet (PoE) is implemented, verify that the proper conductor gauge cable is used that supports the wattage or current supplied by a PoE Ethernet switch to the powered device. Category 6 cables typically are constructed of 23-AWG conductors. PoE Power Sourcing Equipment (PSE) standards range from type 1 to type 4 supplying 15.4 to 90w respectfully.
A handheld Ethernet cable test set is the practical approach to ensuring confidence in proper Ethernet cable wiring, total segment length and PoE current delivery. Capabilities of the test set can range from basic cable verification to cable qualification test.
Beware the mismatch
Once you have ensured that the physical cabling is not at fault, it’s time to verify the Data-Link or layer 2.
A common cause of performance degradation is often attributed to a duplex mismatch between an Ethernet switch port and a host. A duplex mismatch results when the two devices (Ethernet switch port and connected host) are not configured the same. The mismatch can occur due to a manual configuration mistake or failure of the auto-negotiation process creating late collisions resulting in errors.
An advantage of a managed or a web managed Ethernet switch is the ability to view individual switch port Cyclic Redundancy Errors (CRC) to verify there are no collisions. Resolution is typically accomplished by hard-setting either or both devices to a common configuration such as full-duplex rather than trusting the auto-negotiation process.
As your logical troubleshooting reaches the Network layer 3 and above, it becomes necessary to “see” the interaction between devices or “see the data on the wire.” A protocol analyzer such as Wireshark is essential to capture real-time application data between hosts. Wireshark is an open-source packet analysis software tool that I consider the oscilloscope of network communications.
Its full scope and capabilities are well beyond the scope of this article. However, the use of capture or display filters is a useful practice to narrow the captured or displayed packet data.
A capture filter will minimize the amount of data captured to those host devices defined by the filter. A display filter simply limits the data displayed. An IP address filter can be used to see the interaction of a single host device with other devices. Due to the amount of network data typically captured in just a few seconds, a filter becomes essential to focus upon a specific area of interest as you essentially search for the “needle in the haystack.”
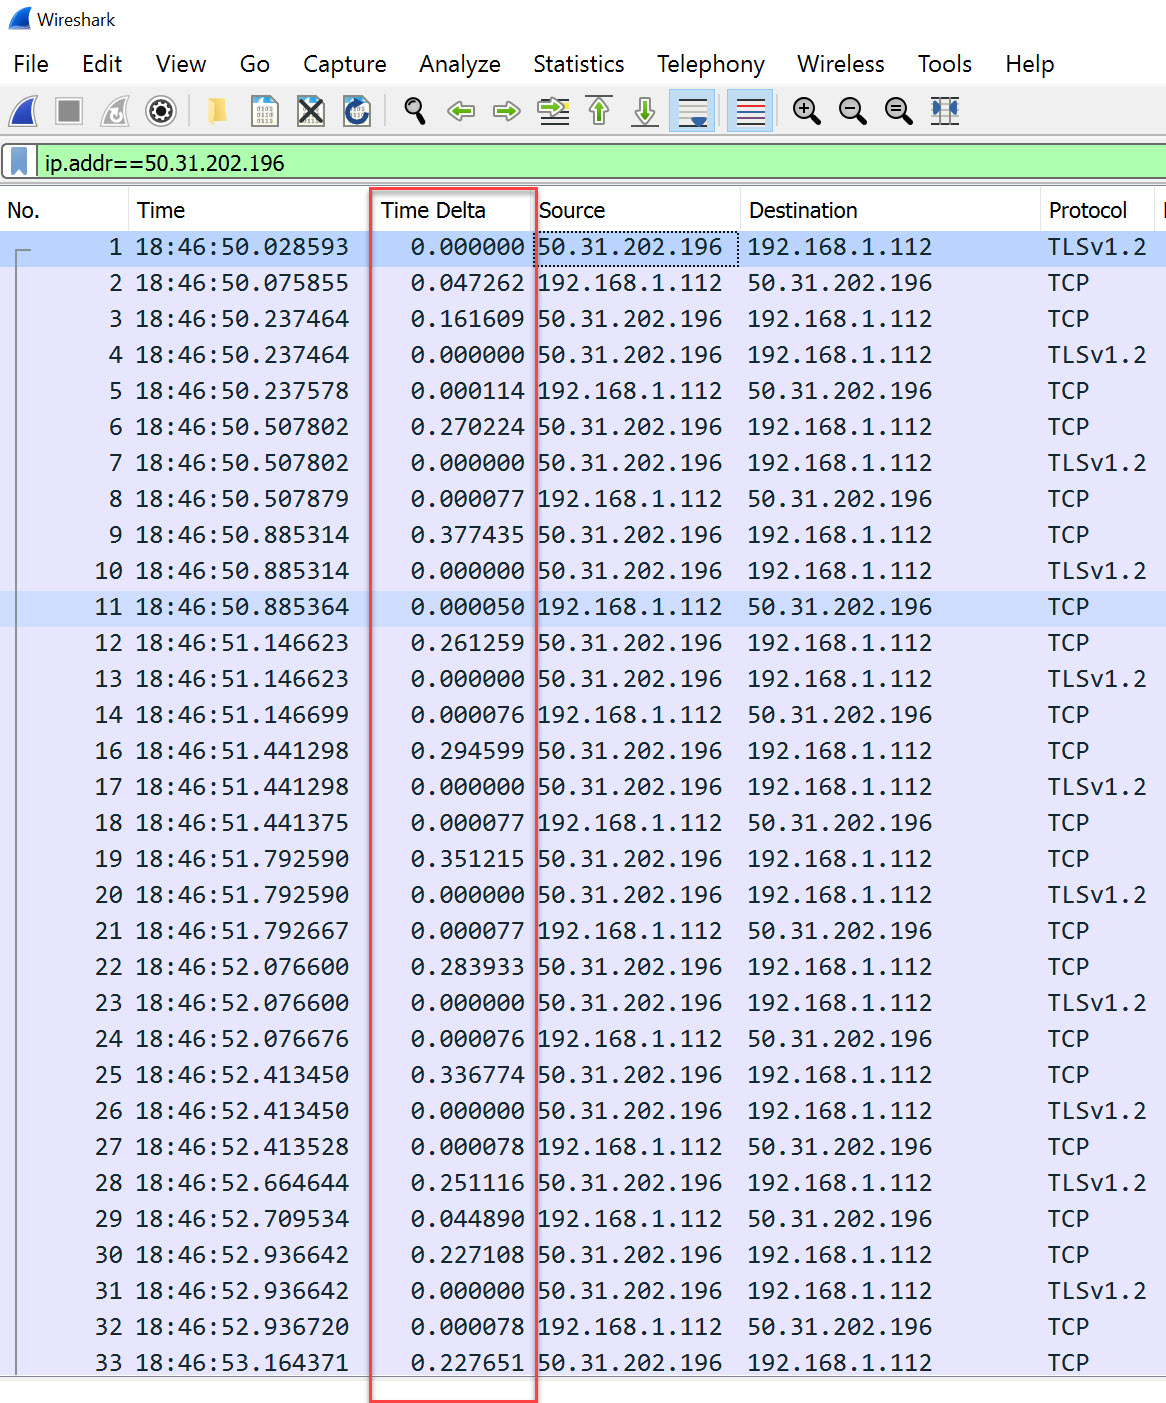
The Time column of the default Wireshark display indicates when the packet was captured. The default is the number of seconds since the capture began, but can be changed to display clock time in various formats including sub-second resolution.
A useful approach to troubleshooting performance issues is to add a “Time Delta” column to the default Wireshark column arrangement. This approach may make significant response delays or Transmission Control Protocol (TCP) retransmissions between host devices of interest more apparent.
Keep in mind that accurate network documentation can also be a timesaver in network troubleshooting and might be essential for someone not familiar with the network environment involved.
[Read Part 8 of this series here]
The webinar on which this article is based, and many others, are available to anyone for a modest fee, with members receiving a discounted rate and free to those with the SBE MemberPlus upgrade. Consider joining if you are not a member at sbe.org.