This is the second in a series about the annual Techsurvey; read the first here.
The time is coming when more listeners will access their favorite radio stations via digital platforms rather than traditional broadcast signals.
The latest Techsurvey from Jacobs Media indicates that the gap is closing quickly, even among the devoted radio listeners who make up this survey.
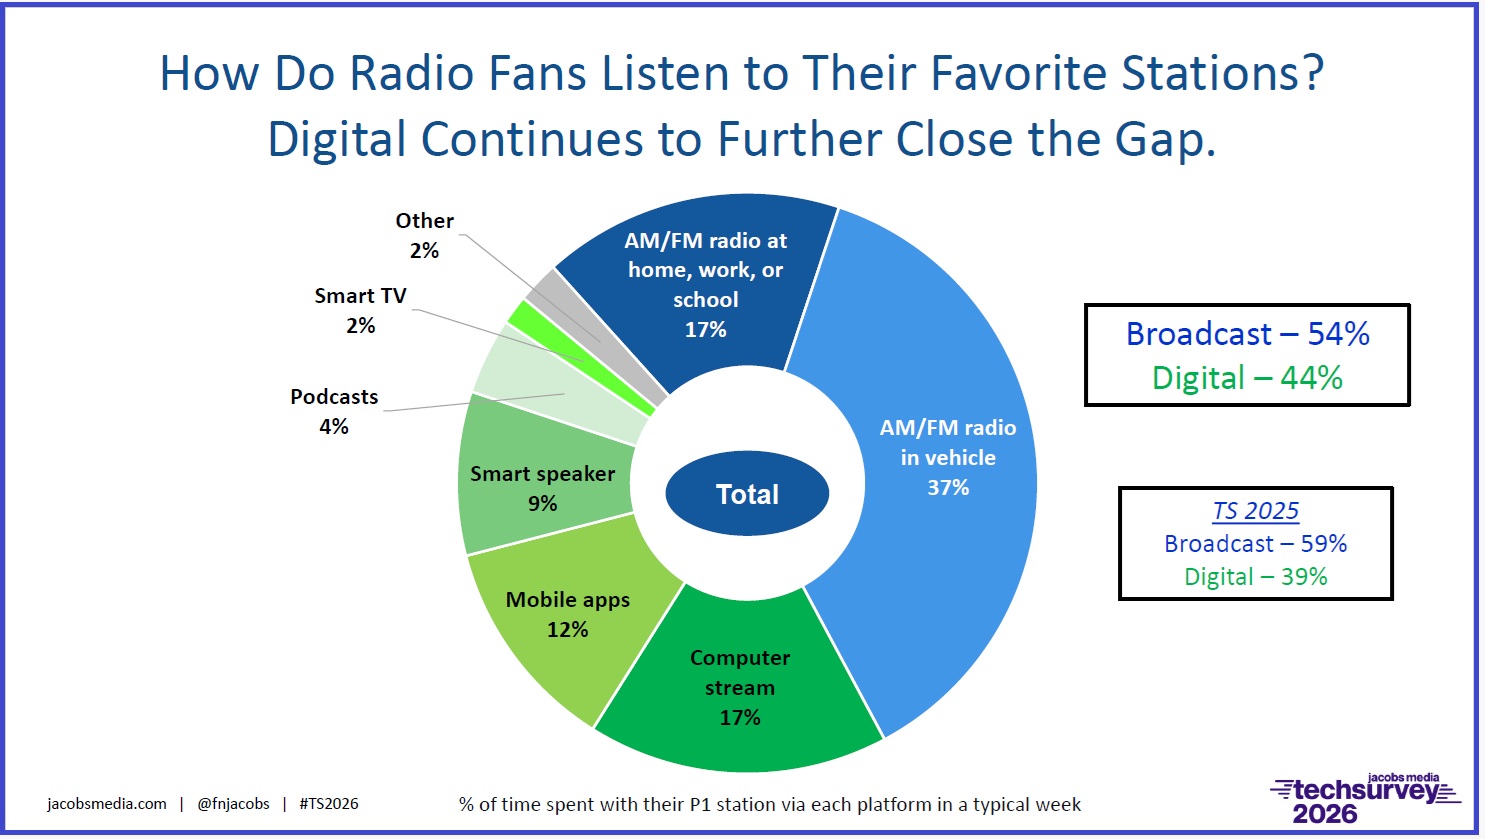
Jacobs asked respondents what percentage of time they spent in a typical week listening via broadcast versus digital platforms such as computers, mobile, smart speakers, podcasts or smart TV options.
The results reveal a dramatic trend line: 54% of respondents consistently listened to regular radio and 44% on digital platforms. On a graph, the lines are converging and likely to cross in several years if things continue in this direction.
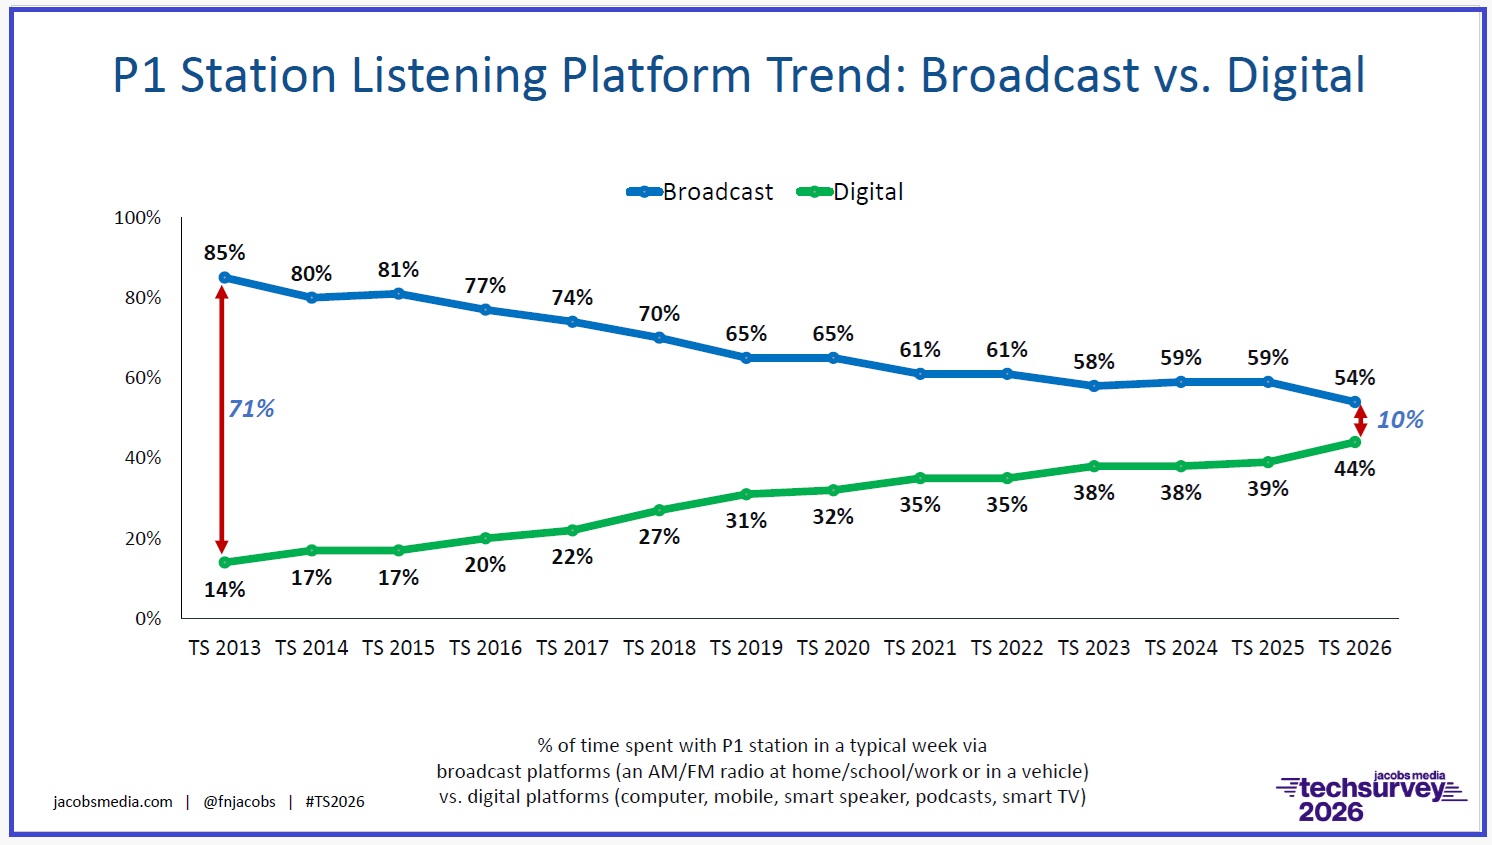
“Just truly a remarkable story here on one chart. The gap there between broadcast and digital back in 2013 was a 71-point difference. Now take a look at this year, only a 10-point gap,” President Fred Jacobs said on a webinar about the survey.
When you look closer at how respondents consume radio, below, the Jacobs research finds in-vehicle still makes up the most of traditional radio listening at 37%, with another saying they listen to radio at home or work. The computer stream is popular (17%), mobile apps (12%) and smart speaker (9%) account for the highest listening percentages.
When Jacobs breaks out the data by demographic splits, over the air isn’t leading among all age groups. For instance, Gen Z is showing a pretty much an even split, with survey respondents saying they listen 49% digital and 48% over the air radio.
Traditional radio listening grows its lead over digital as you move through age groups. For instance, Millennials at 52% broadcast vs. 46% digital, while Boomers clocked in at 57% broadcast and 41% digital.
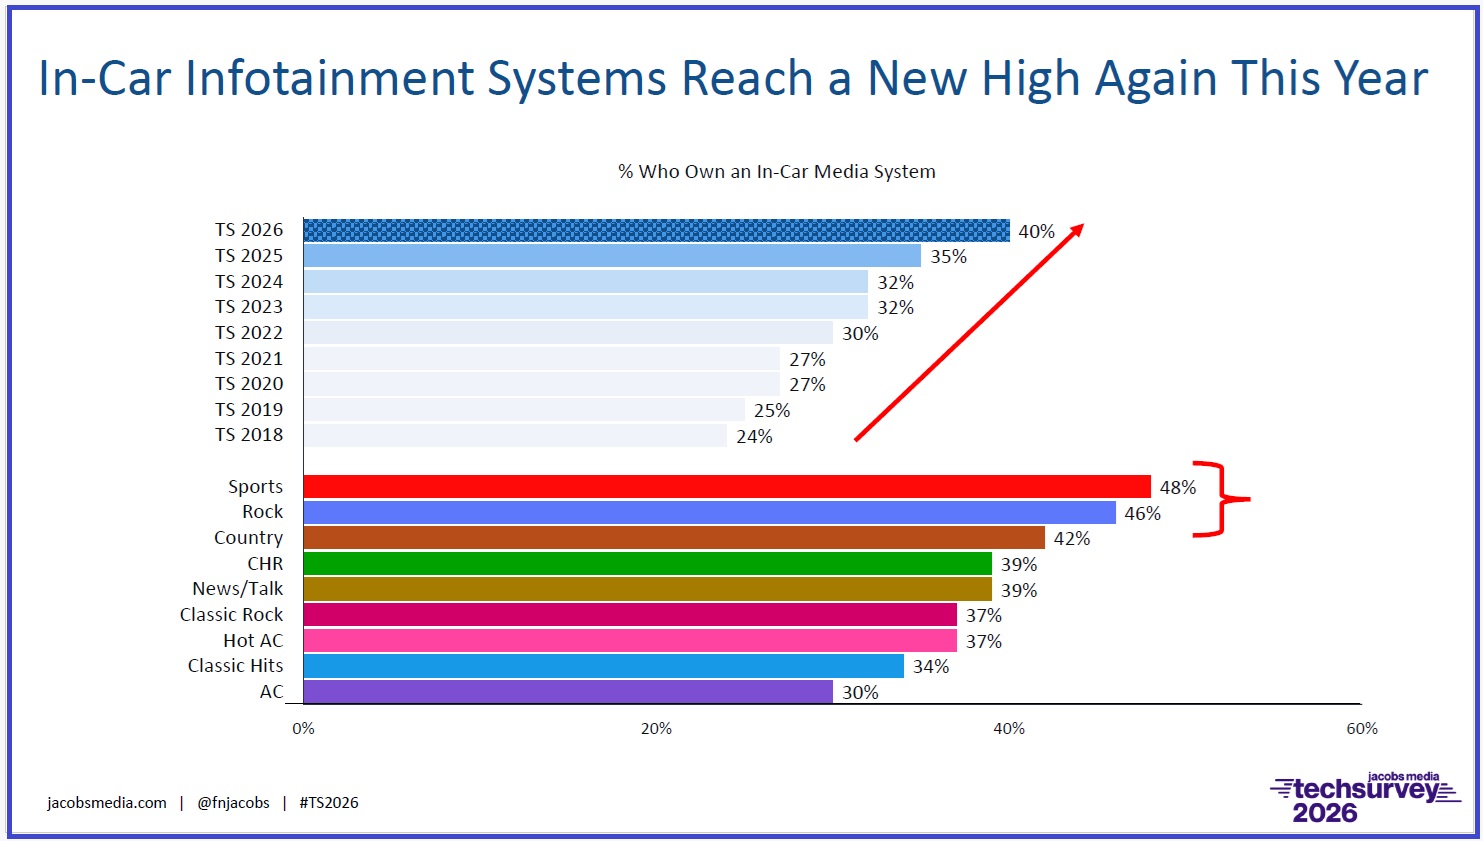
While fewer than three in four Techsurvey respondents now have regular radios at home, in-vehicle listening continues to show strength despite increased entertainment offerings in the dashboard, according to the findings. In-car infotainment systems have reached an all-time high. Now 40% in the survey have in-car media systems compared to 25% in 2018.
“It’s almost impossible even to buy an entry-level vehicle without an infotainment system at this point,” said Fred Jacobs. “These are systems like Ford Sync and Audi Connect.”
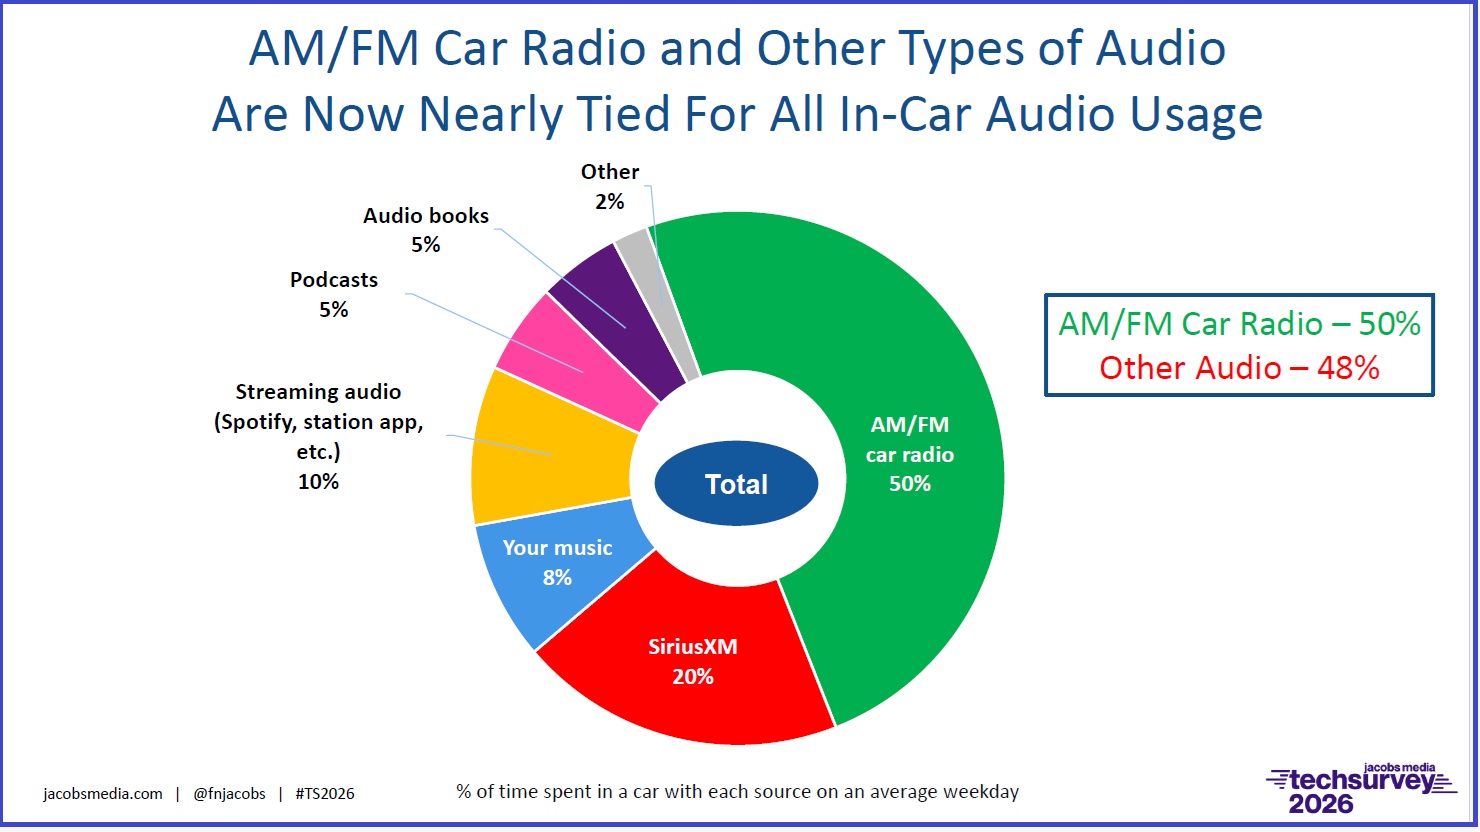
OTA radio is still a dominant force in the car, with 50% of respondents saying they listen to AM/FM, though other forms challenge it when taken in aggregate. Satellite radio was a distant second with 20% of in-vehicle consumption.
“Then we’ve got streaming audio coming from somewhere at 10% personal music, 8%, podcast, 5% talking books another 5%. But you add them all together and you’ve got other audio at 48%, so it’s already close. And that 50% mark for AMFM car radio is in jeopardy of continuing to go down,” Jacobs said.
The survey’s 31,000 or so participants were selected from email databases of 506 commercial radio stations in the U.S. across major radio formats. As Jacobs explained, the respondents are typically “radio fans” to begin with.
For the first time in several years, Audacy stations provided listener data so they could participate in the survey, Jacobs said.
Unique to Techsurvey is what Jacobs calls the Net Promoter Score (NPS), which is a way of measuring how likely someone is to recommend listening to their favorite radio station to others. This year, the NPS was 46, which has remained remarkably consistent since 2010, Jacobs said
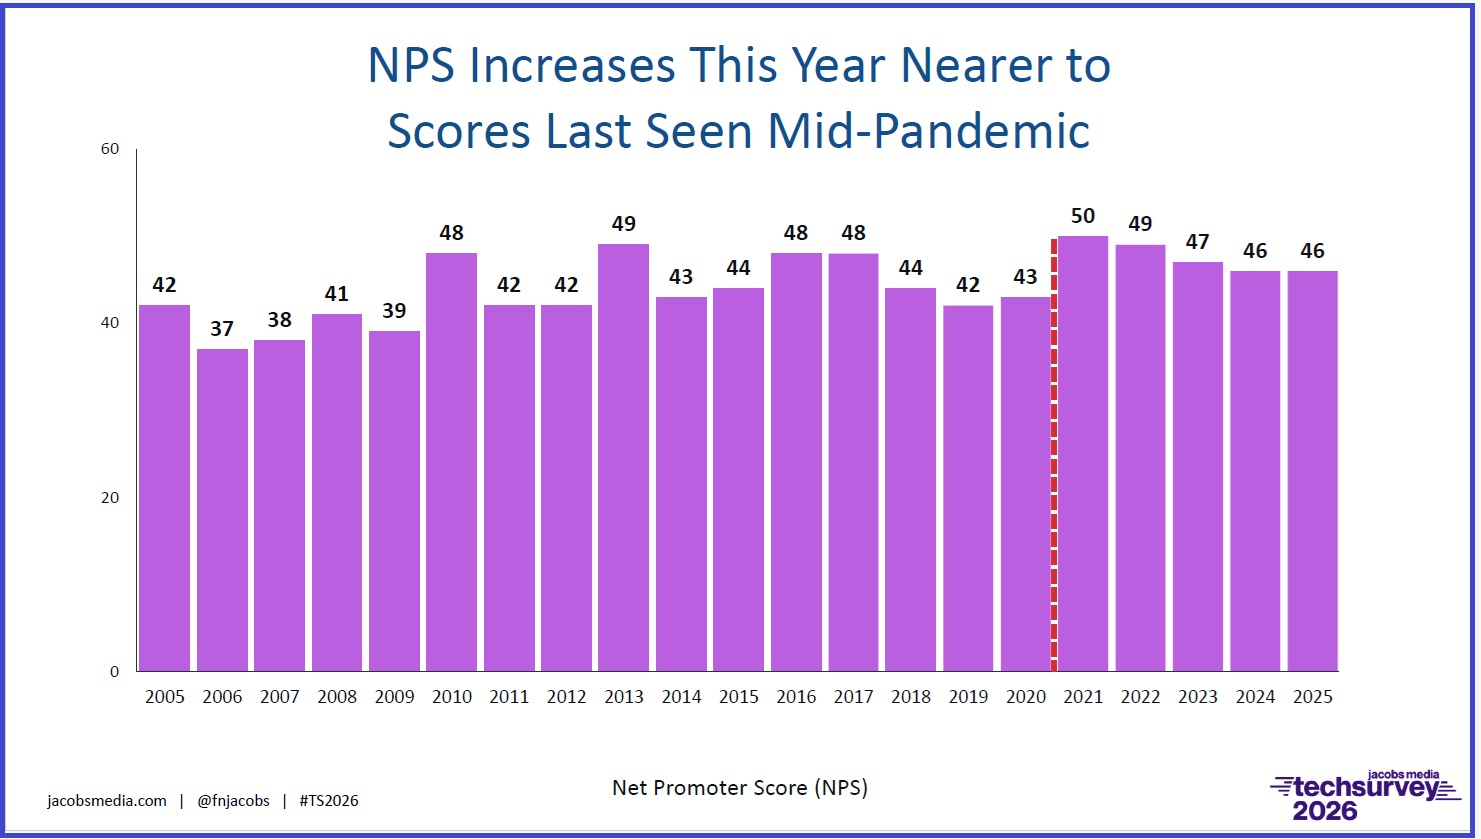
“The way it works is this, on a scale of zero to 10, how likely are you to recommend the station that sent you the survey? Ten is extremely likely, zero is not at all likely. So if you look at the scale, you can see it’s a very high bar. In order to be considered a promoter, you’ve got to give the radio station a nine or a 10,” he said. “A detractor is a zero through six.”
Radio World will continue to break down the TS2026 finding in the coming days. Next time we examine the importance of radio’s visuals and in-vehicle metadata.