It’s been a few years since we’ve discussed RDS best practices, but the items we have covered in this series of articles over the last decade are more relevant than ever.
At this point, just about every new automobile manufacturer supports some form of RDS when a receiver is tuned to an analog FM station.
The big shift is that visibility and support for the Program Service (PS) field and PS scrolling are fading in favor of RadioText (RT) and RadioText Plus Tagging (RT+ Tagging).
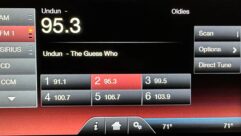
Larger 6- to 12-inch LCD displays are in almost every vehicle you see on the lots now. These have multiple lines for text messages, and the eight-character PS scrolling really does catch the eye. The full station name, title and artist with RadioText and RT+ Tagging really helps stations look better in the dash.
Also, with National Highway Traffic Safety Administration guidance and regulations related to driver distraction in the United States, many automotive manufacturers have dampened or defeated PS scrolling from working in their vehicles.
Even with RadioText, modern receivers want more information, and RT+ Tagging is supported in more vehicles. Radio World has covered a variety of topics on how to optimize RDS for these fields, and other tips and tricks. You can find that information in a 2018 ebook at radioworld.com.
Another great resource is “NRSC-G300-C: RDS Usage Guideline,” last updated April 2018). It can be found online at www.nrscstandards.org, under Standards & Guidelines.
RDS Subcarrier Injection
Let’s dig into detail about the importance of proper RDS subcarrier injection. This is still a common problem I work with, both in my professional capacity at iHeartMedia and personally as I travel and see various RDS implementations across the country.
While it’s difficult to come up with hard facts, a lot of stations are not following the NRSC-G300-C guidelines in Section 4 to ensure there is proper synchronization with the 19 kHz pilot and maintaining 6% (4.5 kHz) to 7% (5.25 kHz) injection of the 57 kHz RDS subcarrier.
First, let’s understand how the RDS subcarrier injection is described numerically.
Often in North American broadcast products, documents and discussion, you will see the RDS subcarrier injection referenced in terms of percentage, such as 6%. This is referenced as 6% out of 100% modulation referenced to 75 kHz deviation. So, 75 kHz x 0.06 (6%) = 4.5 kHz deviation. And 75 kHz x 0.07 (7%) = 5.25 kHz deviation.
You will often see these methods used (percentage and referenced as deviation) when discussing injection, sometimes interchangeably.
Suppose you have a measurement made in kHz deviation and want to translate that into percentage. For example, a modulation analyzer may say the RDS injection is 4.875 kHz but not tell you the percentage:
4.875 kHz / 75 kHz = 0.065 x 100 = 6.5%
The international markets are more focused on kHz deviation levels. You may encounter product measurements, manuals, documentation or other articles referencing kHz deviation, and now you know the basic math converting between these two. We’re really discussing the same thing, just a different reference level.
Regulatory Guidance
In the United States, no Federal Communication Commission authorization, notice, application or license is required by a broadcast station licensee wishing to transmit a subcarrier. Subcarriers are also known as Subsidiary Communications Authority or SCA. A subcarrier or SCA is a separate audio or data channel transmitted along with the main audio signal over a broadcast station. RDS is considered an SCA, and stations can start or stop transmission at any time as per 47 CFR Section 73.293.
The FCC allows total FM carrier deviation above 100% modulation referenced at 75 kHz under 47 CFR Section 73.1570(b)(2)(i) and (ii). The total peak modulation may be increased 0.5 percent for each 1.0 percent subcarrier injection modulation, but in no event may the modulation of the carrier exceed 110 percent (82.5 kHz peak deviation).
What does this mean in practical terms?
If your 57 kHz RDS subcarrier is the only subcarrier on the station, and you desire 6% injection, half of that injection (3%) can be added to your overall total modulation envelope. Thus, the maximum permitted FM modulation envelope on the station is 103%, or 75 kHz x 1.03 = 78.25 kHz deviation.
Field Observations
My general advice and guidance for most full-power stations is to use 6% (4.5 kHz) injection as optimal for most applications.
You may want to consider up to 7% (5.25 kHz) injection if you are on a noisy channel with nearby co-channel interference, have extreme terrain challenges in your service area or are trying to provide the best experience in the far field (i.e. the desired, or largest portion of your audience is at or beyond your protected service contours).
Another area where higher injection helps is on lower-powered stations such as translators. Many FM translators are used well beyond their official “protected” 60 dBu service contour, so having a high injection level on these stations is encouraged.
Raising the injection of the subcarrier increases the signal-to-noise ratio of the digital subcarrier and makes it easier for receivers to decode it error-free, especially in the far field and in challenging FM environments (multipath, interference, low signal, etc.).
While this evidence is anecdotal, I have never seen a situation where going above 7% (4.5 kHz deviation) has been helpful. And I have found stations unintentionally injecting over 10%, actually causing some RDS receivers to stop working. In a sense, if the signal is too high, it can degrade decoding performance in select receivers.
Similarly, I find a lot of stations out there that are injecting below 4% (3 kHz deviation), where RDS decoding is very difficult.
Both situations (subcarrier injection too high or too low) can cause spotty RDS displays. Information may never populate or may not update quickly upon change. Focusing on your RDS injection and knowing it is in the 6% to 7% range is very important.
Measuring Injection
Knowing how to set up your RDS encoder injection properly is important. It’s a key performance item for RDS displays to work.
With the growing receiver base, and with more broadcasting offered enhanced metadata with station branding, title, artist and even advertiser messages, you want to make sure every station you maintain has the RDS injection set properly.
RDS injection measurement has long been an issue. Many engineers in the field do not have access to tools to measure this important metric. We will discuss some available products, new ones that you can buy as well as common legacy offerings you might be able to find on the shelf somewhere.
One important note: It is highly desirable to make this measurement at the RF sample output of your exciter or transmitter This gives you the most accurate reading before environmental effects are put into the equation (such as multipath).
Many of these products will work anywhere within the coverage area, and you could locate them at the studio, for example, if you have good RF reception there. However, you will notice all of your FM modulation parameters are subject to more variations. For the most stable results, it’s best to measure this at the transmitter site.
Note that when using an RF sample output, be sure you do not exceed the maximum input specifications of the measurement device. When in doubt, use attenuators to be safe, and slowly decrease the attenuation to get a high desired signal without overloading the unit. Variable attenuators are the best for this application.
Belar
Belar is a well-known vendor in this space, and it offers highly accurate RDS injection measurement tools in their flagship FMHD-1 product. This is some of the most comprehensive details I’ve seen out of a monitor specifically related to RDS injection.
As shown in Fig. 1, you can view the current average RDS in the Analog Bar Graph menu, and you can view a detailed histogram of RDS injection, measured in percentage, over time.
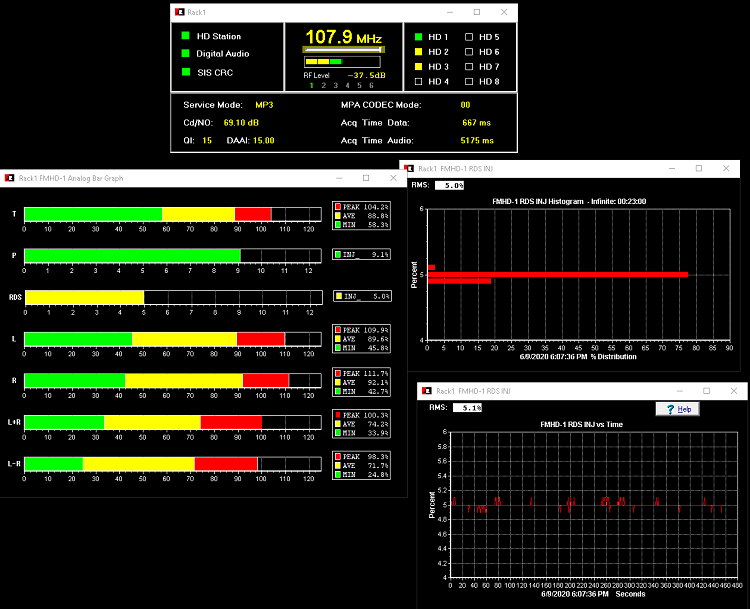
These details can be viewed using a software application connected to the FMHD-1, and it can be accessed remotely if attached to a computer that has Remote Desktop, VNC or another screen sharing solution installed and running.
Belar offers FMCS–1L and the RDS-1, which interface with their Wizard line of analyzers that show RDS injection.
DEVA
DEVA has several products in its portfolio that offer RDS injection monitoring. Shown in Fig. 2 is the Band Scanner Pro.
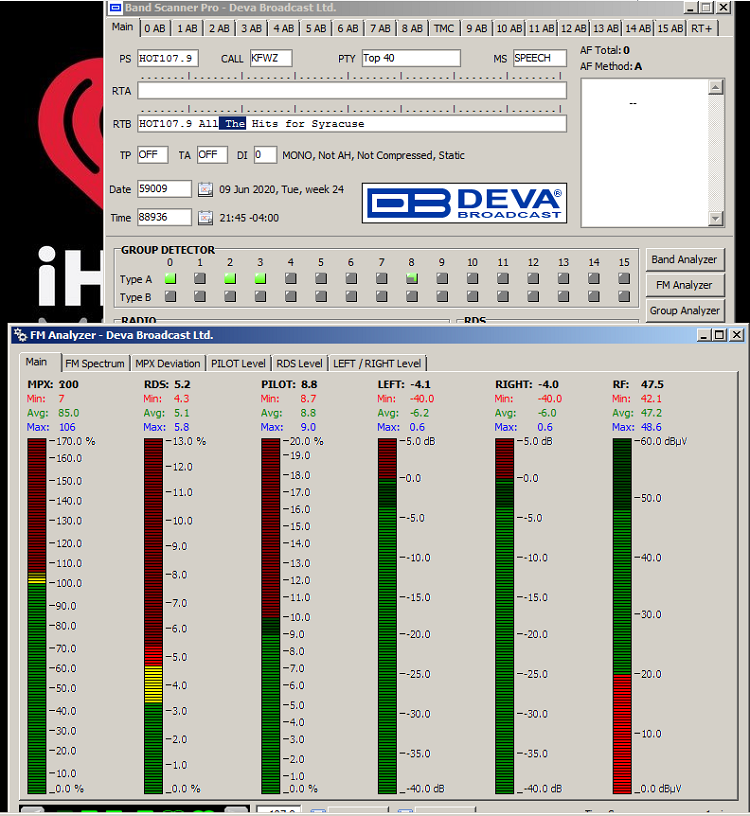
What I like about the Band Scanner Pro is that it’s portable and can go into your laptop bag and go from site to site easily. It travels well on planes and such. It’s a very small, portable tool that offers easy access to diagnostics of all RDS parameters and allows the user to dig into deeper binary information contained in the RDS subcarrier.
DEVA also makes the Radio Explorer line, the DB4005 rack-mount monitor that can be accessed remotely, and other products that can measure RDS injection.
Inovonics
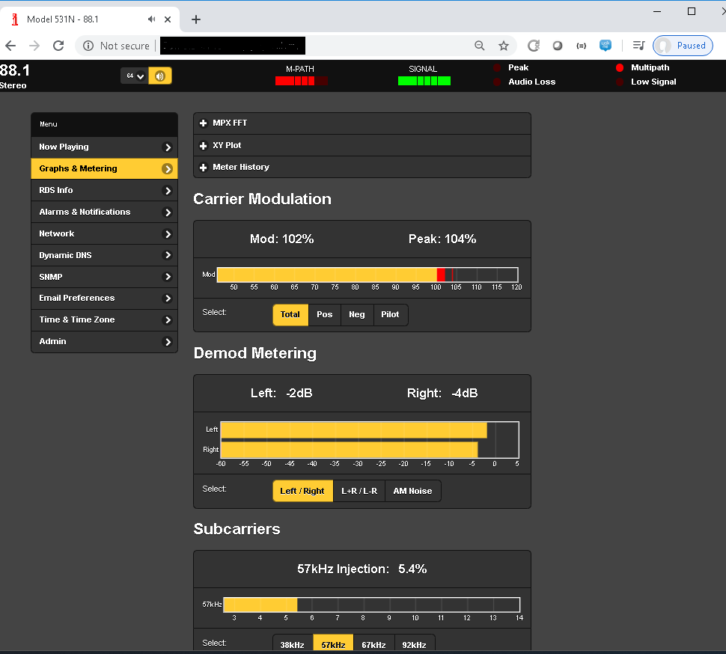
Inovonics offers the 531N FM modulation monitor, which has a native HTML5-based web browser to remotely access and view measurements. Included in those measurements are the RDS injection, as shown in Fig. 3.
Inovonics also made a model 510 RDS monitor. While no longer in production, you might find legacy units around the shop or in the rack. This model can calculate RDS injection when calibrated properly.
WorldCast/Audemat
WorldCast and Audemat have long been in the RDS space. Many engineers are familiar with their line of RDS encoders, but they have made several products that can monitor RDS as well.
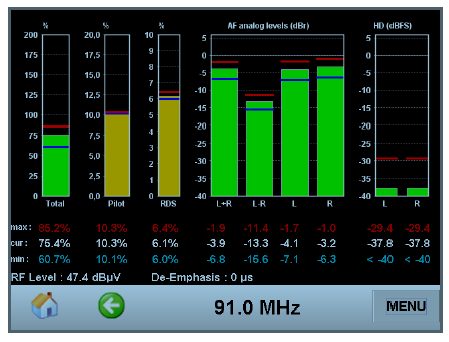
A popular legacy product that has many field installations is the Audemat Golden Eagle. It offers RDS injection measurements on its front panel as shown in Fig. 4. The Golden Eagle HD also offers it in the remote client software package.
Audemat also has the Navigator and Navigator HD, FM MC5 and other products, current and legacy, that measure injection.
A recent breakthrough in RDS encoding products on the market, the Audemat RDS Encoder 2019 model, includes an FM tuner in the encoder that can be used for continuous RDS injection measurements. This really is a nice touch, and I’m happy that WorldCast/Audemat included an integrated receiver in this product.
This helps close the gap of stations not having the proper equipment to measure RDS injection, as well as other parameters. I’ve heard countless times where an engineer is on-site installing an RDS encoder or making changes to the air chain, only to tell me they do not have a modulation monitor, nor an RDS receiver in their car. The new Audemat RDS Encoder resolves both problems. The tuner’s results are available in the same HTML5 interface that you use to configure the RDS encoder. So, those stations who chose this product can have a 1:1 ratio of RDS encoder and RDS monitoring.
Also, as discussed, having the modulation monitor at the transmitter site yields more accurate results. Having the RDS encoder at the transmitter site is also highly desired and offers optimal transmission of the RDS signal.
Combining these functions into a single device at the transmitter site solves many problems that we have had in the industry of not having the correct test and measurement equipment for RDS.
In Fig. 5, you can see the FM Tuner tab showing the RDS injection as well as decoded PS, RadioText, PTY Code with format name resolution, TA/TP status modes, Alternate Frequency (AF) listings decoded, as well as displaying the PI Code with legacy NRSC-4 callsign back-calculation (does not work on some stations as per NRSC-4-B and NRSC-G-300-C).
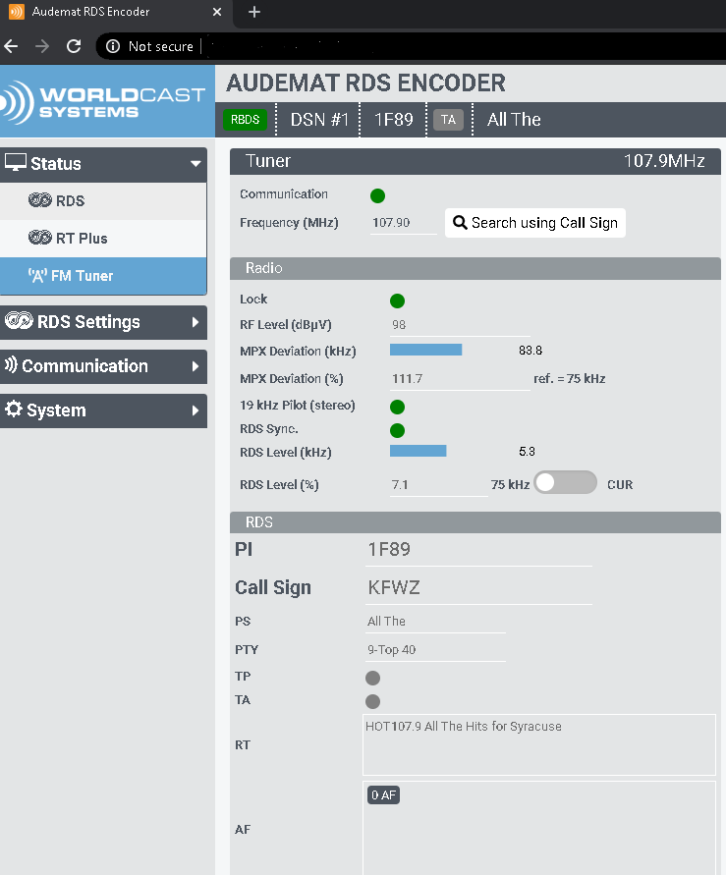
This is a nice combination of hardware to have in the field, and I strongly recommend that other manufacturers consider an integrated tuner to close the test and measurement gap that nearly every broadcast engineer in the field has encountered.
What If I Don’t Have an Analyzer?
The list above offers a comprehensive (but not all inclusive) view of products that are available on the market to measure RDS injection.
Inevitably you may occasionally find yourself in a situation where you do not have a professional injection measuring device at your fingertips. Maybe the station you are working on does not have a monitor that measures injection, or maybe you just forgot to bring it to the site.
While it is typically not quite as accurate, the method discussed below can achieve very good results, especially on a modern exciter.
Temporarily kill the analog FM audio on the station, leaving the stereo pilot and RDS subcarrier online. Many exciters offer a 100% scale (default) and an extended scale that shows 10% to 20% modulation. With the analog audio silent, and if you know the FM pilot injection (you should; it’s an FCC requirement), you can reasonably calculate the RDS injection by subtracting the total modulation minus the FM pilot.
For example, in Fig. 6, we show a GatesAir Flexiva FAX-50 exciter on the test bench, with no analog modulation, 8% 19 kHz stereo pilot injection. The extended modulation scale reads 12.5%, so it can be reasonably assumed that the RDS subcarrier is 12.5% – 8% = 4.5%.
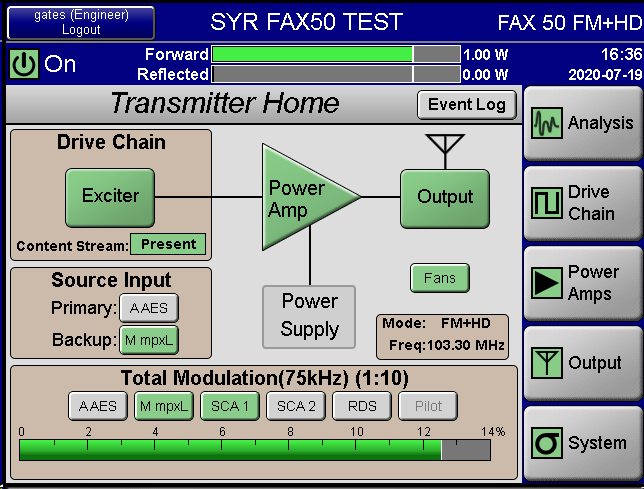
When you are using this method, I strongly recommend running a quick confirmation test by disabling the RDS encoder’s output in software, or disconnecting the SCA BNC output to your air chain temporarily. Total modulation should in this case drop from 12.5% to 8%, thus confirming the 4.5% difference is indeed the RDS subcarrier and not some other source of signal or noise in the measurement.
This trick will get you out of a bind, although it has some downfalls. I strongly recommend using an RDS injection monitor for accuracy, and to minimize disruption to your listeners. After all, this last example requires you to create dead air on the live broadcast station, and often you need to adjust in the encoder’s output, or processor/exciter input stage, prolonging the period of dead air. There’s also the potential of measurement error, since the expanded scale of the exciter is not specifically looking for the 57 kHz subcarrier, and does not decode RDS. Precision matters now that RDS is so visible in the dashboard.
Alan Jurison is a senior operations engineer for iHeartMedia’s Centralized Technical Operations Engineering team. He chairs the NRSC Metadata Usage Working Group. His opinions are not necessarily those of iHeartMedia, the NRSC, Radio World or our sponsors.
