Following up its recent report on the 141 local markets where at least 20% of the market listens to AM radio, Nielsen has released a deeper look with new data at the state- and DMA-level.
Pierre Bouvard, chief insights officer of the Cumulus Media / Westwood One Audio Active Group, recently posted an analysis of the findings. The data comes from the Fall 2022 survey, but is based on all U.S. radio stations, not just Nielsen subscribers.
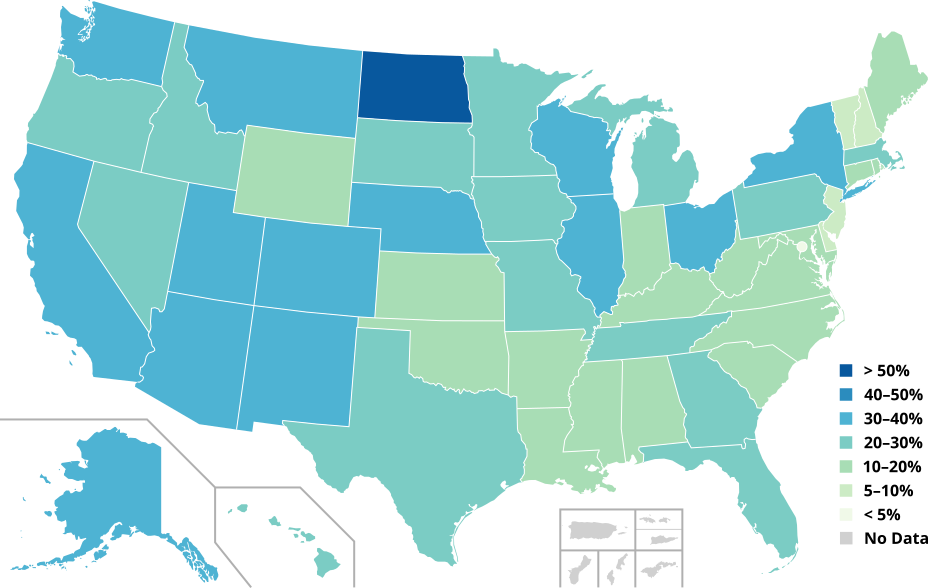
Nationwide, 30.9% of radio reach comes from AM stations, representing 82,346,8000 American radio listeners aged 12+ who listen to AM every month. At the state level it ranged from a high of 52.7% in North Dakota to a low of 4.6% in the District of Columbia. In 29 states, the percent of radio reach via AM is greater than 20%.
Bouvard noted that the state analysis reveals states with the largest proportion of AM listening tend to be from the Midwest, but not exclusively. The states with the largest AM radio usage have a wide variety of sizes and broad geographical diversity.
[Related: “Here Are the Markets With the Largest Proportion of AM Radio Listeners”]
Because the survey counted the reach by state based on where the station was licensed, there may be some over-/under-counting in some areas. For example, cross-border listening to AM stations based in Mexico recorded a monthly reach of 12.6%.
The DMA-level analysis found that the largest proportion of AM listening tended to be in smaller, rural markets in the Midwest, but they represent a wide variety of DMA sizes and geographies.
The top DMA for AM reach was the smallest DMA in Nielsen’s ratings, #210 Glendive, Mont., at 72.1%. The lowest reach was in DMA #208 Alpena, Mich., at 3.8%. Among the top 10 DMAs, only two saw an AM monthly reach lower than 30%: #7 Houston at 29.6% and #8 Washington, D.C. (Hagerstown, Md.) at 11.8%.
Below are the top 25 DMAs in terms of percentage of AM reach.
| DMA Rank | DMA | Monthly AM/FM net reach | Monthly AM net reach | % AM Reach |
| 210 | Glendive, Mont. | 6,800 | 4,900 | 72.1% |
| 207 | Juneau, Alaska | 22,400 | 14,500 | 64.7% |
| 54 | Buffalo, N.Y. | 1,220,800 | 655,900 | 53.7% |
| 38 | Milwaukee [PPM+D] | 1,760,800 | 944,400 | 53.6% |
| 166 | Billings, Mont. | 230,200 | 122,300 | 53.1% |
| 145 | Minot–Bismarck–Dickinson, N.D. (Wlstn) | 311,100 | 164,300 | 52.8% |
| 113 | Fargo, N.D. | 505,100 | 265,000 | 52.5% |
| 3 | Chicago [PPM+D] | 7,738,500 | 3,965,200 | 51.2% |
| 36 | Cincinnati [PPM+D] | 1,943,300 | 883,400 | 45.5% |
| 77 | Rochester, N.Y. | 843,100 | 374,700 | 44.4% |
| 209 | North Platte, N.D. | 27,500 | 12,000 | 43.6% |
| 191 | Great Falls, Mont. | 120,700 | 52,600 | 43.6% |
| 203 | Zanesville, Ohio | 67,000 | 28,700 | 42.8% |
| 12 | Seattle–Tacoma, Wash. [PPM+D] | 4,486,400 | 1,920,700 | 42.8% |
| 170 | Rapid City, S.D. | 204,800 | 87,500 | 42.7% |
| 49 | Albuquerque–Santa Fe, N.M. | 1,511,300 | 640,100 | 42.4% |
| 93 | Cedar Rapids–Waterloo–Iowa City–Dubuque, Iowa | 703,900 | 293,900 | 41.8% |
| 201 | St. Joseph, Mo. | 89,100 | 37,200 | 41.8% |
| 31 | San Antonio [PPM+D] | 2,324,300 | 967,100 | 41.6% |
| 199 | Mankato, Minn. | 99,600 | 41,200 | 41.4% |
| 10 | San Francisco–Oakland–San Jose, Calif. [PPM+D] | 6,092,200 | 2,513,500 | 41.3% |
| 101 | Tri-Cities, Tenn.–Va. | 626,200 | 256,100 | 40.9% |
| 119 | Eugene, Ore. | 514,500 | 210,000 | 40.8% |
| 73 | Omaha, Neb. | 912,600 | 366,100 | 40.1% |
| 67 | Spokane, Wash. | 964,200 | 386,100 | 40.0% |
DMAs assign each county (or county equivalent) in the country to a single market based upon television viewership. They tend to be larger geographically than radio metros.
You can download the full list of AM reach by state and DMA through Bouvard’s blog post at Westwood One.